


Lessons
view all ⭢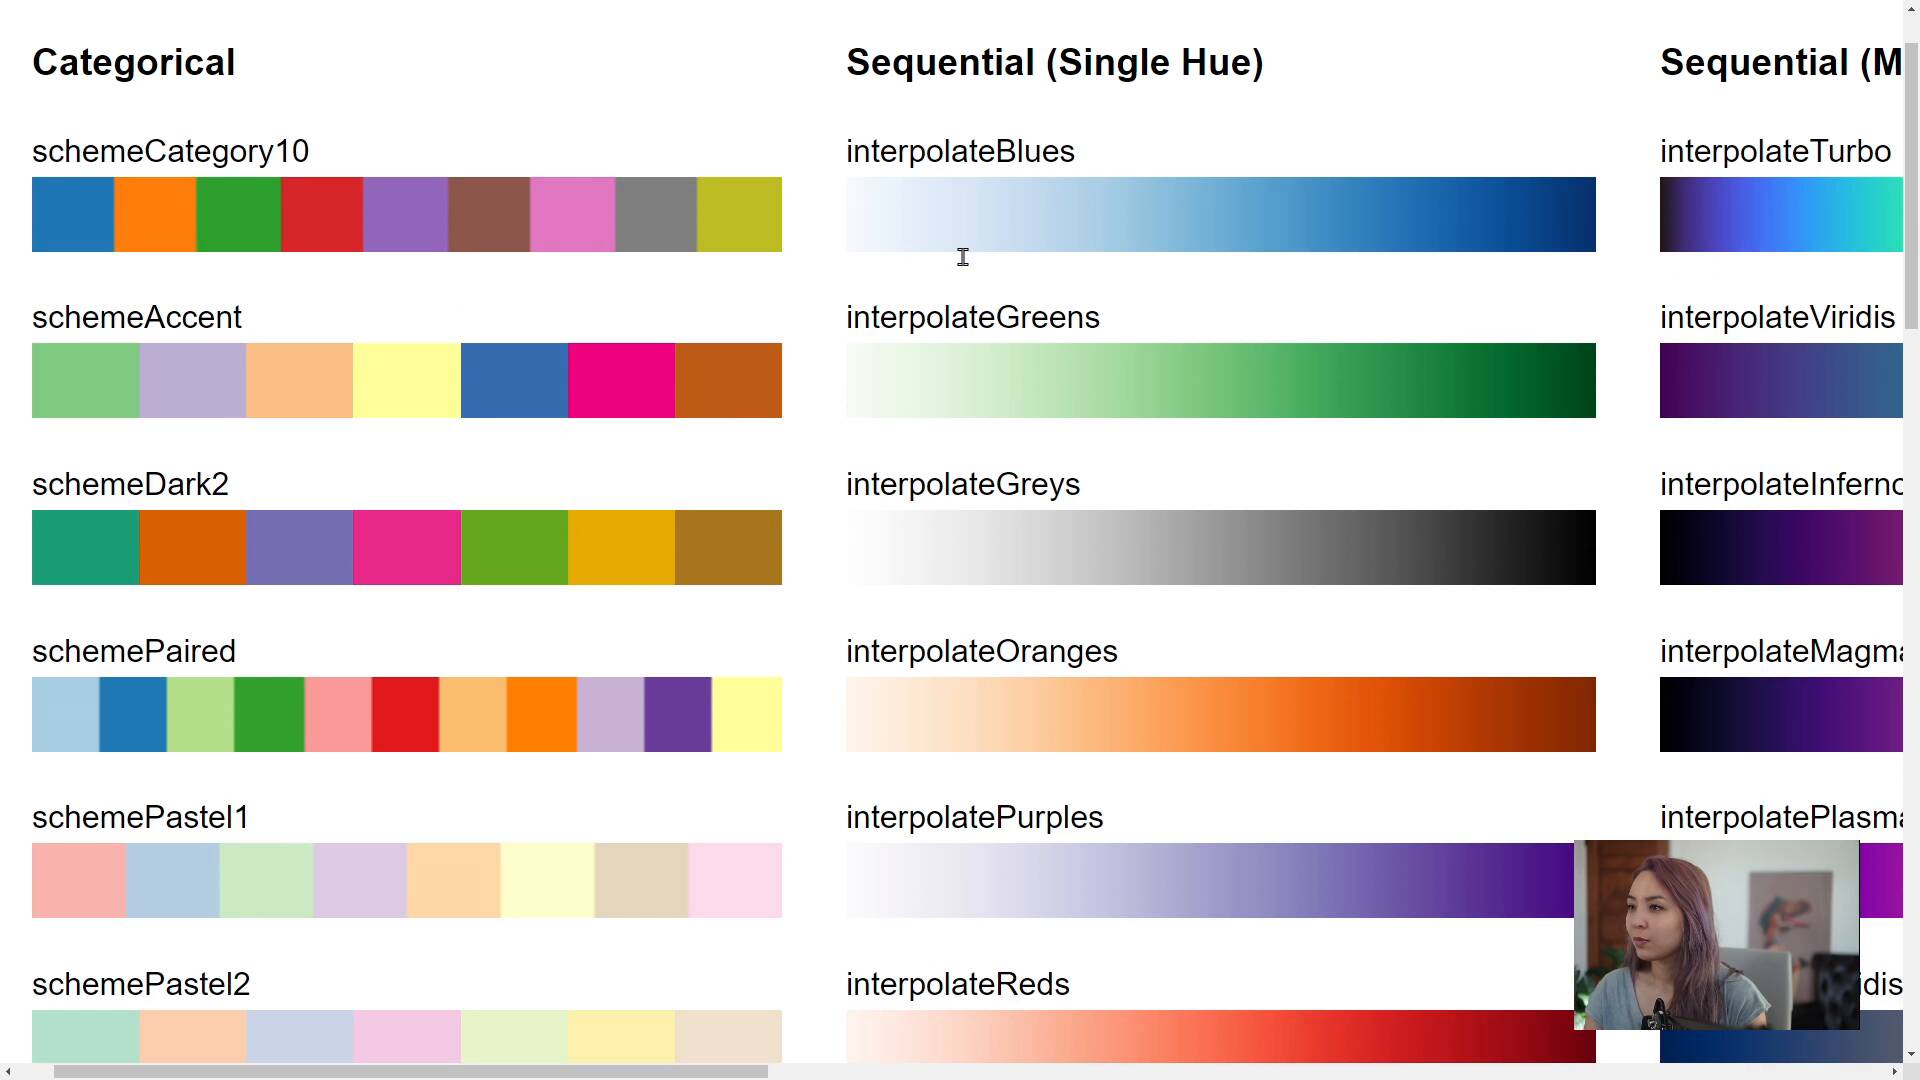
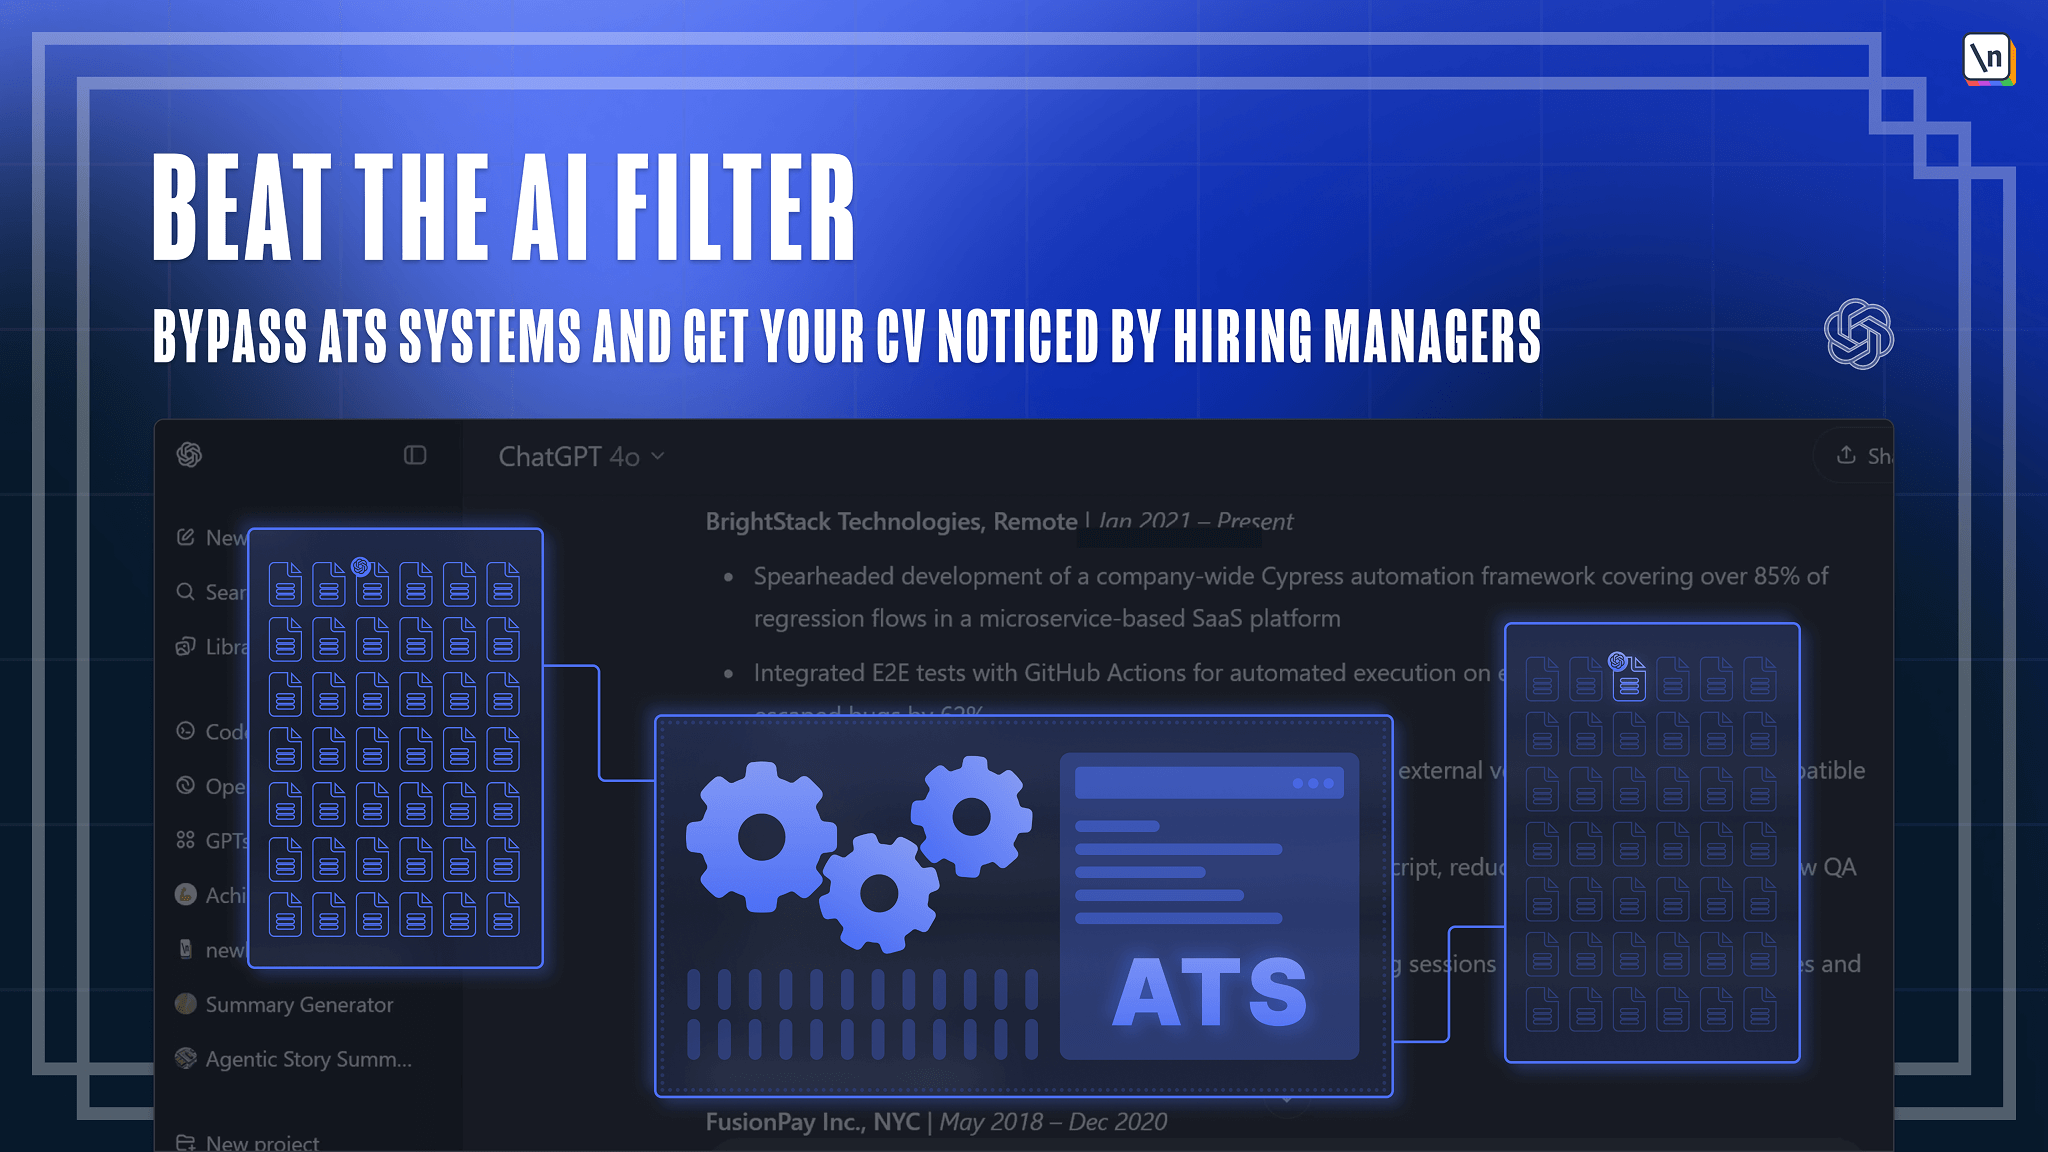
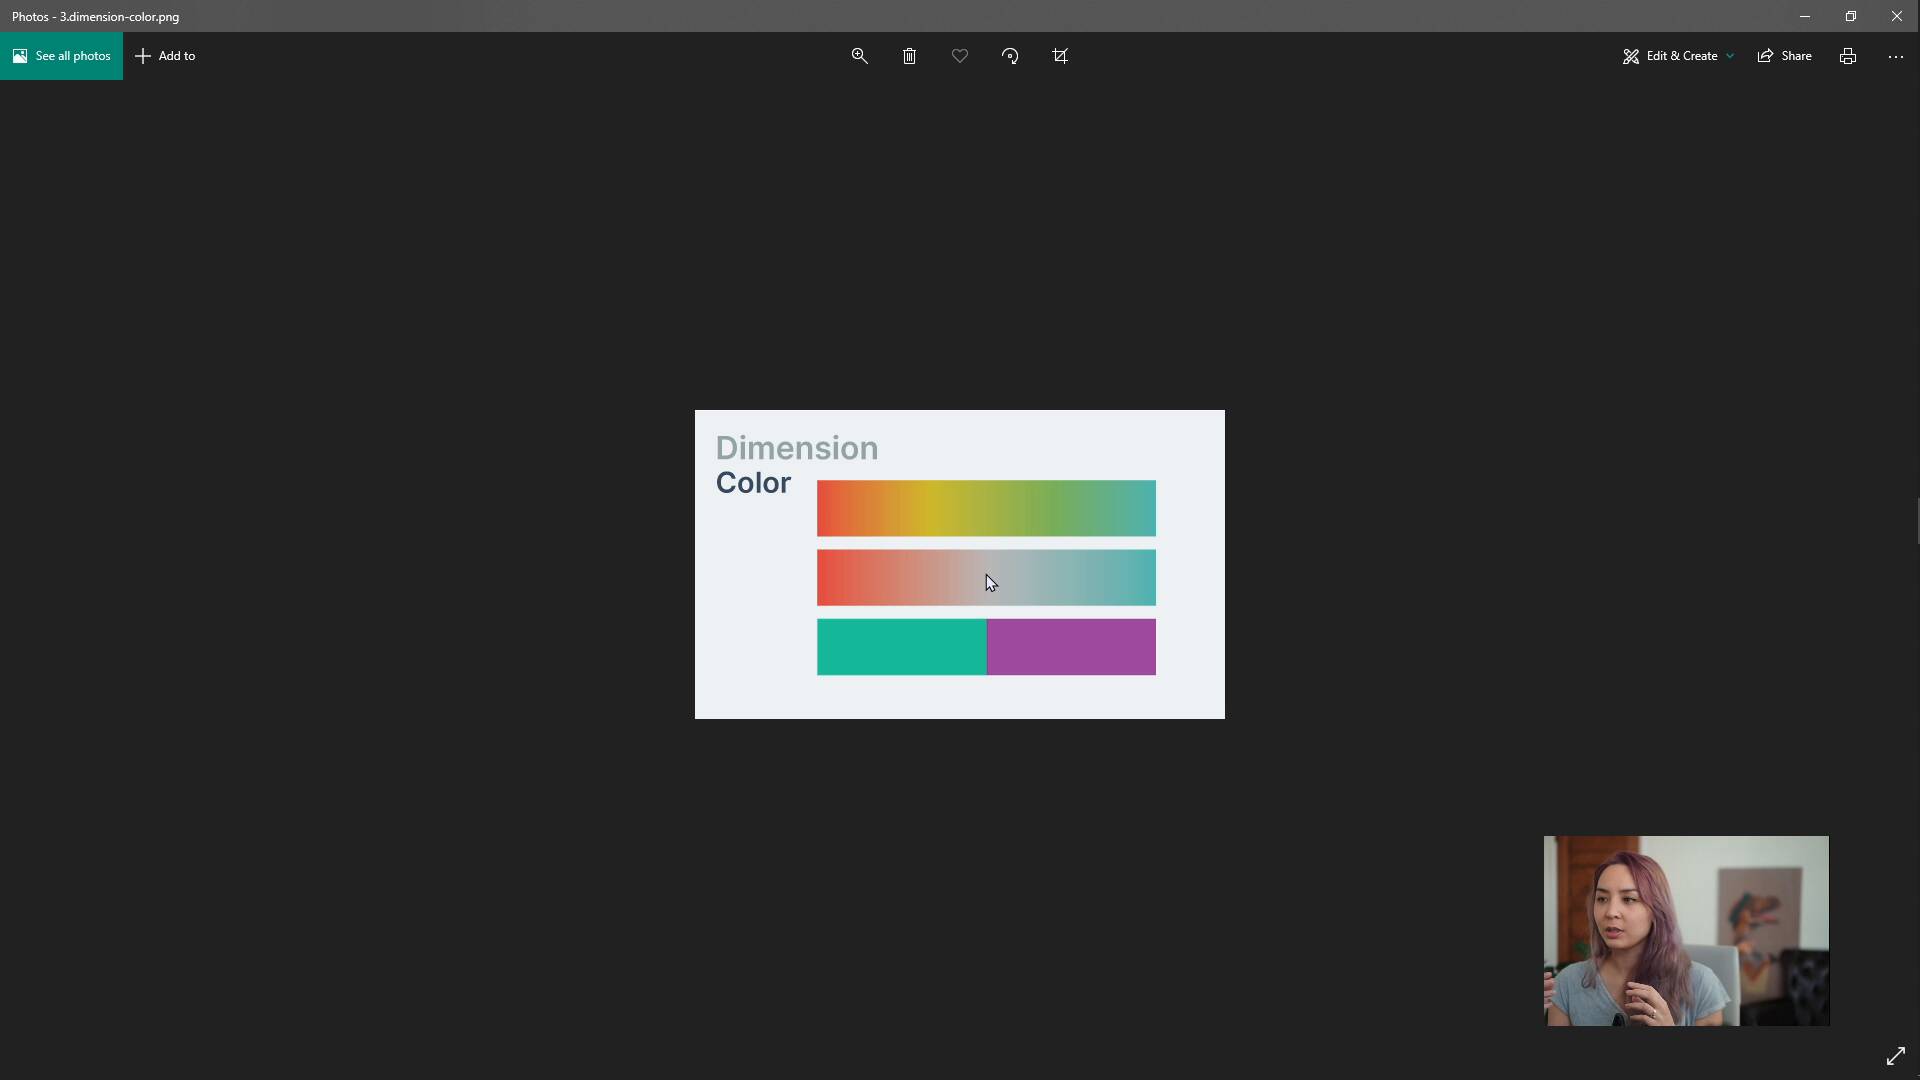
lesson
Color scalesFullstack D3 MasterclassChoosing colors is one of the hardest parts of designing a data visualization! We talk about the three main types of color scales, and related functions that are built into d3.
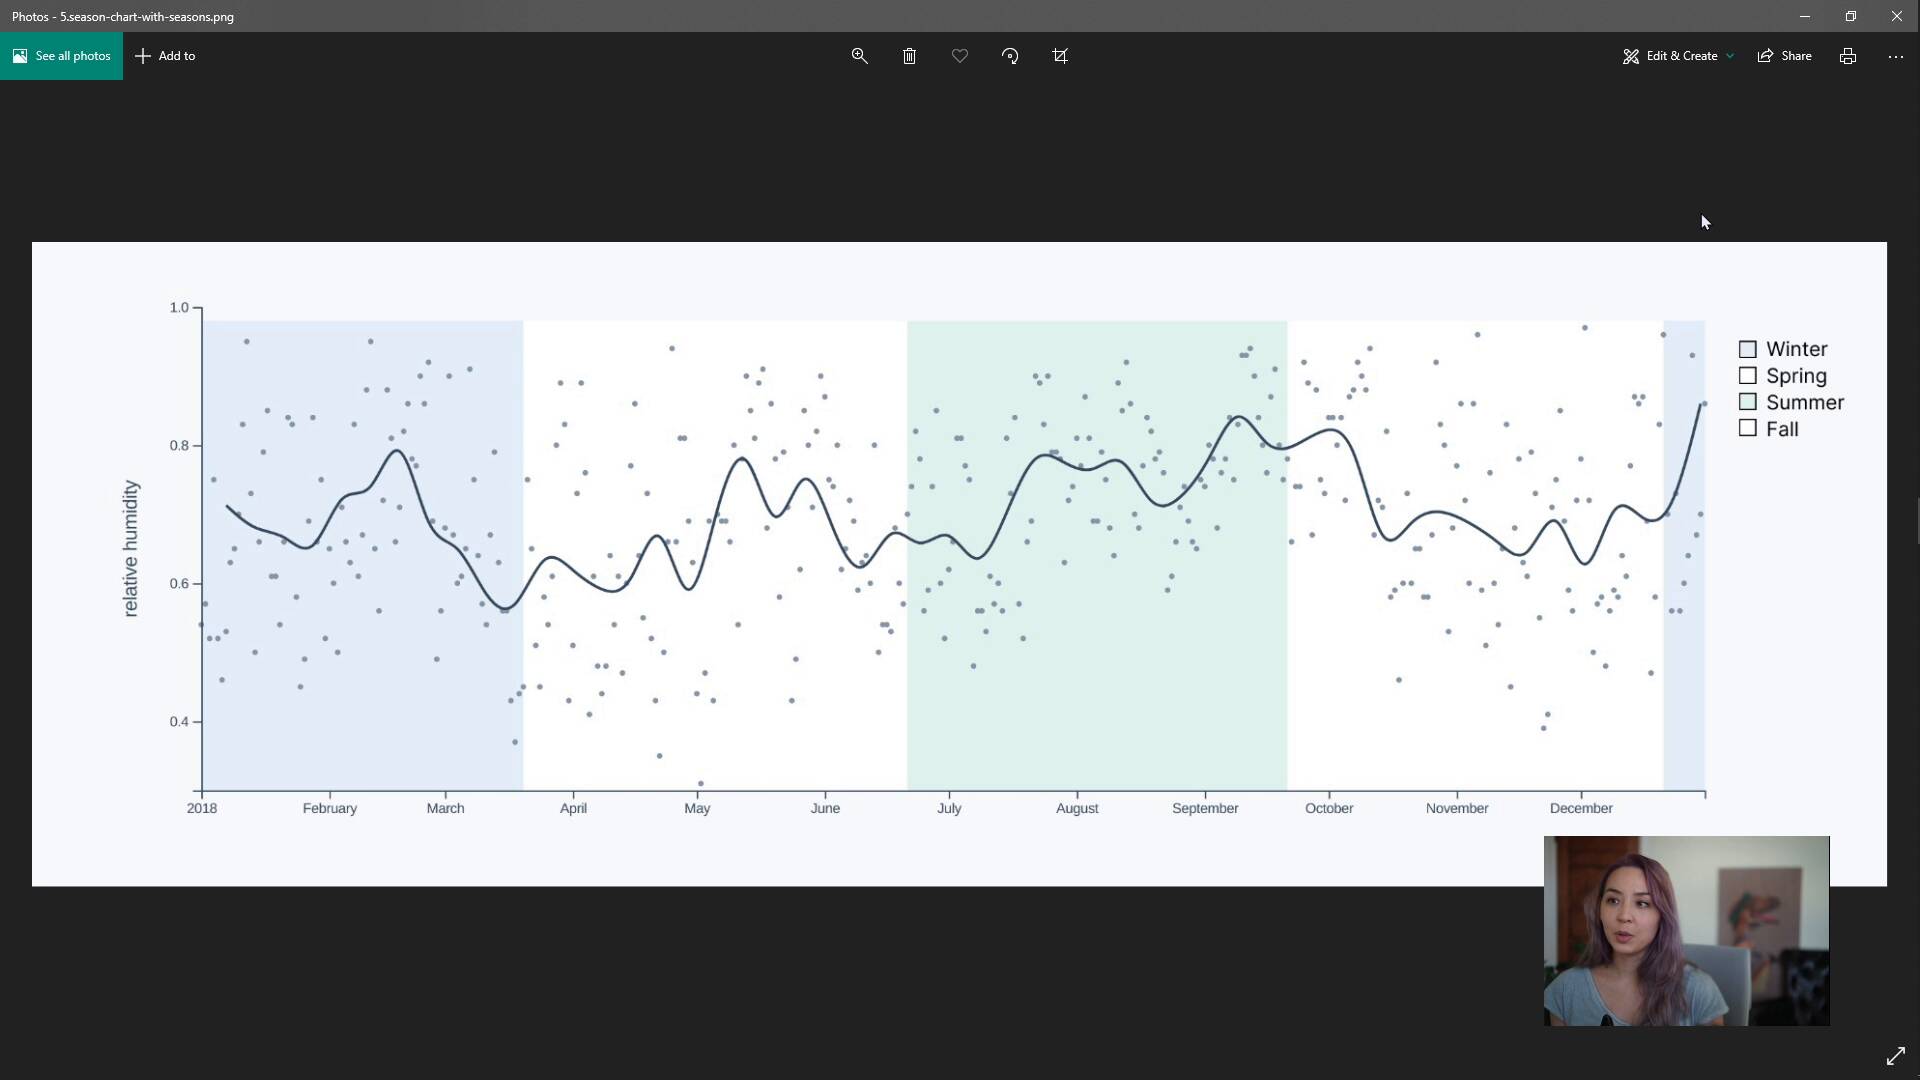
lesson
Example redesignFullstack D3 MasterclassWe run through a full redesign of a chart, learning about the motivation and implementation of each change.
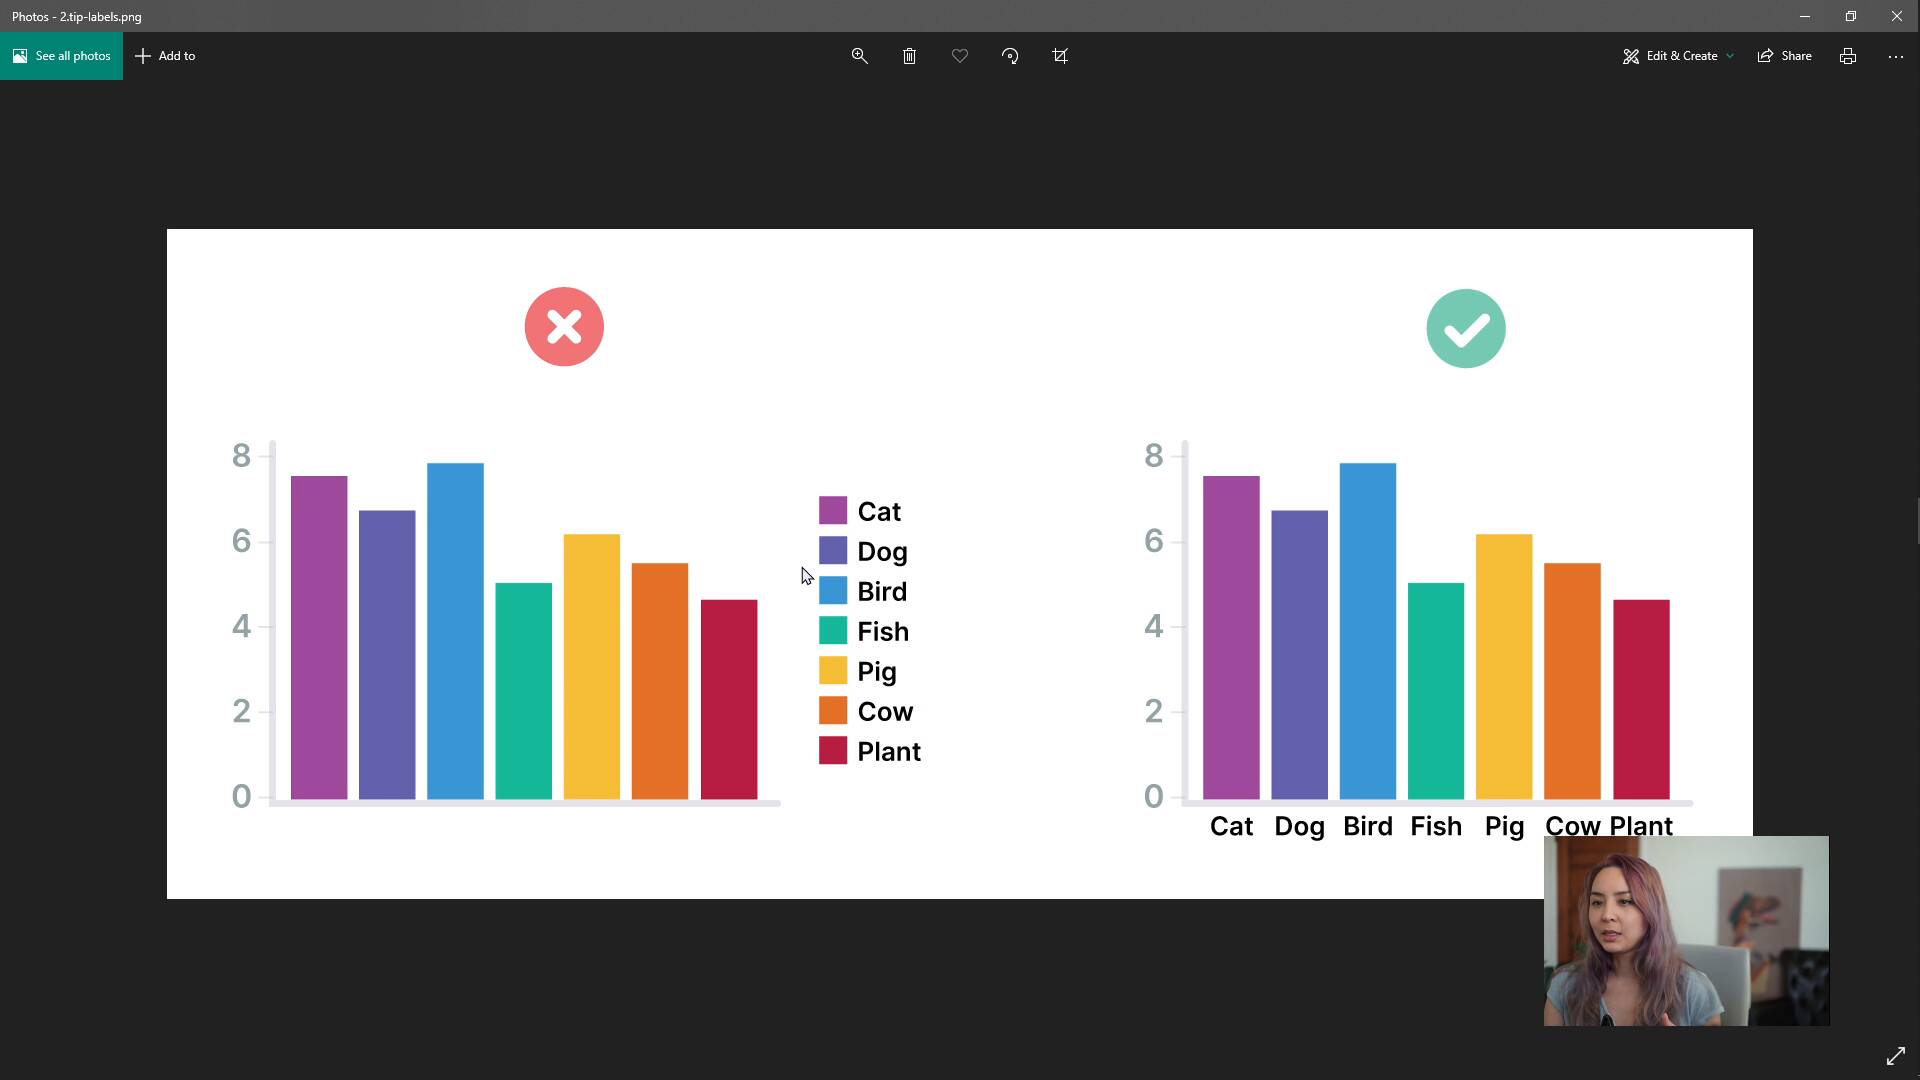
lesson
Chart designFullstack D3 MasterclassWe talk through a few tips & tricks that I use when designing charts.
lesson
Ways to visualize a metricFullstack D3 MasterclassWe talk about the different ways to visualize a single metric, and how to combine that with the different data types.
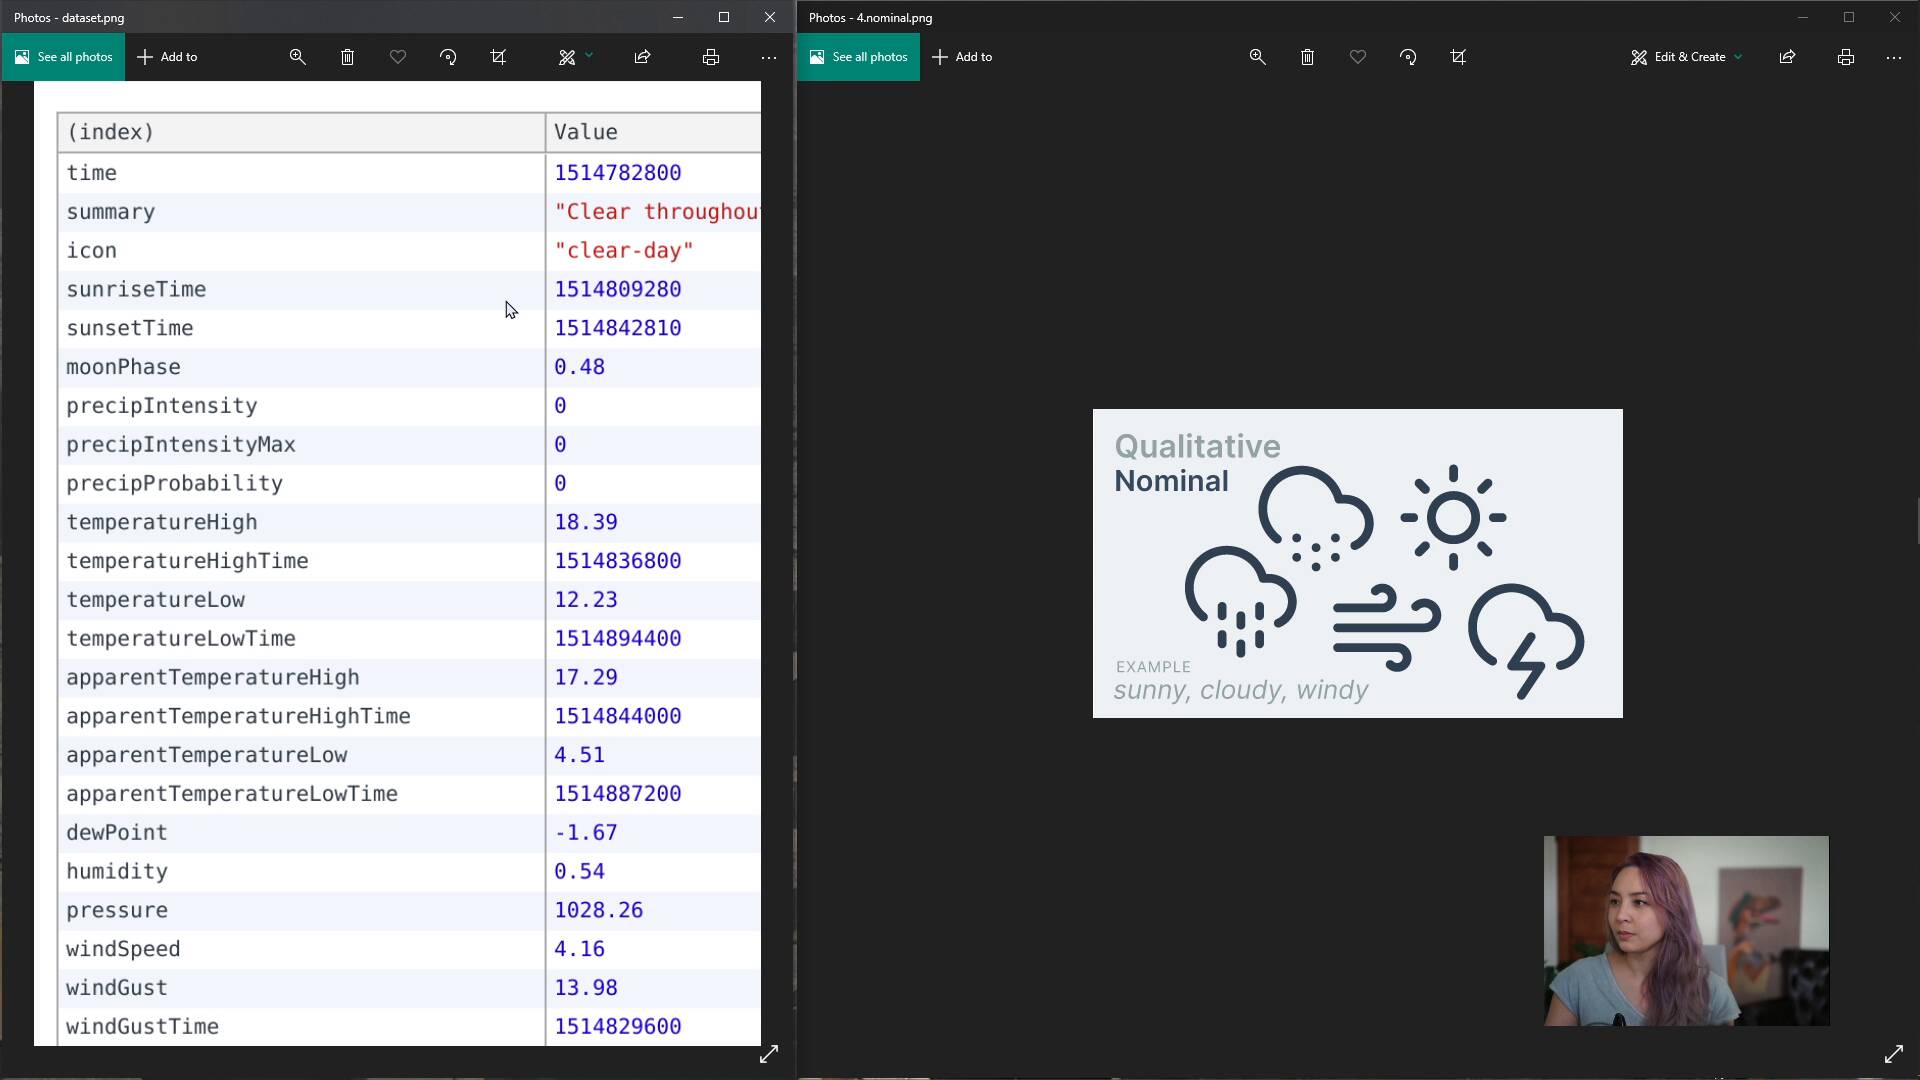
lesson
Types of dataFullstack D3 MasterclassWe talk about the different types of data: the main buckets of qualitative and quantitative metrics, and their sub-categorizations.
lesson
Data Visualization BasicsFullstack D3 MasterclassIt's really important that we understand the fundamentals of data visualization design, and what kind of chart to create.

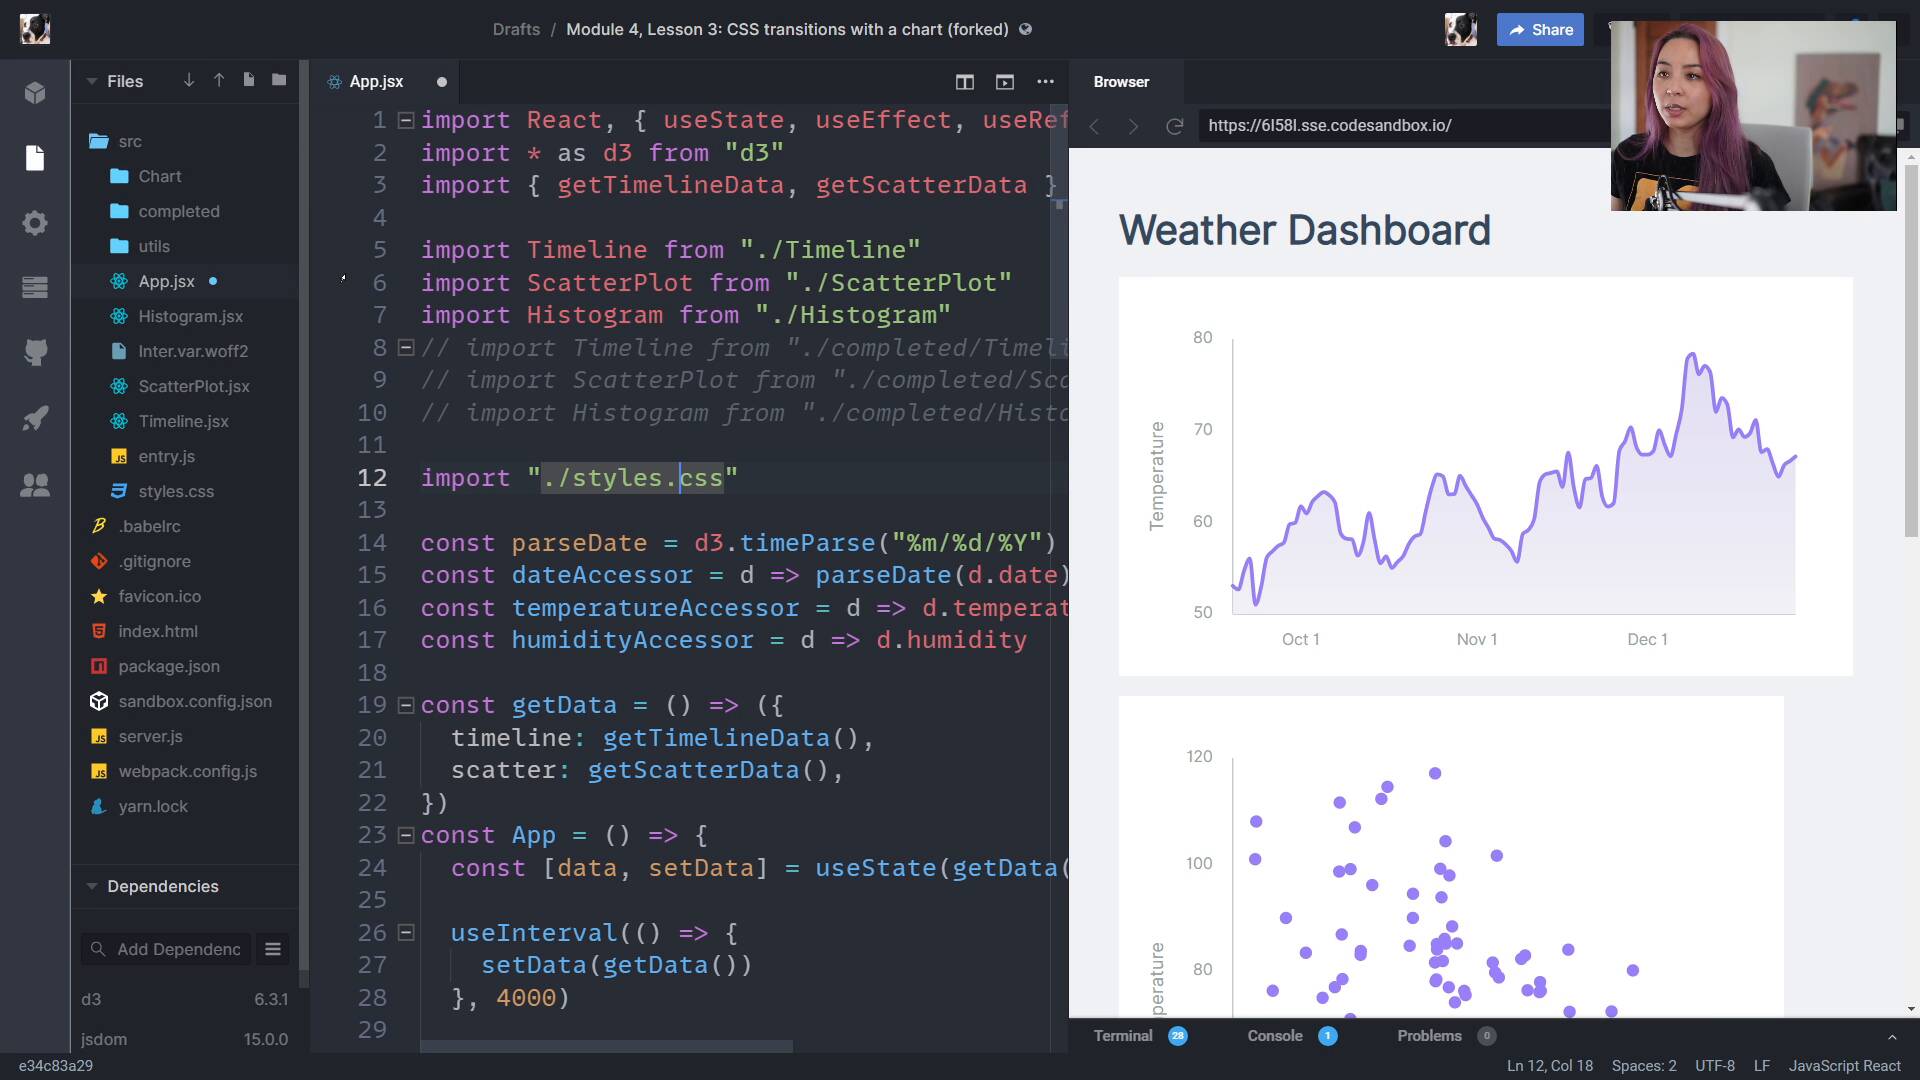
lesson
Digging inFullstack D3 MasterclassWe walk through the structure of our React application, then dive into the first step of our chart drawing checklist: accessing our data
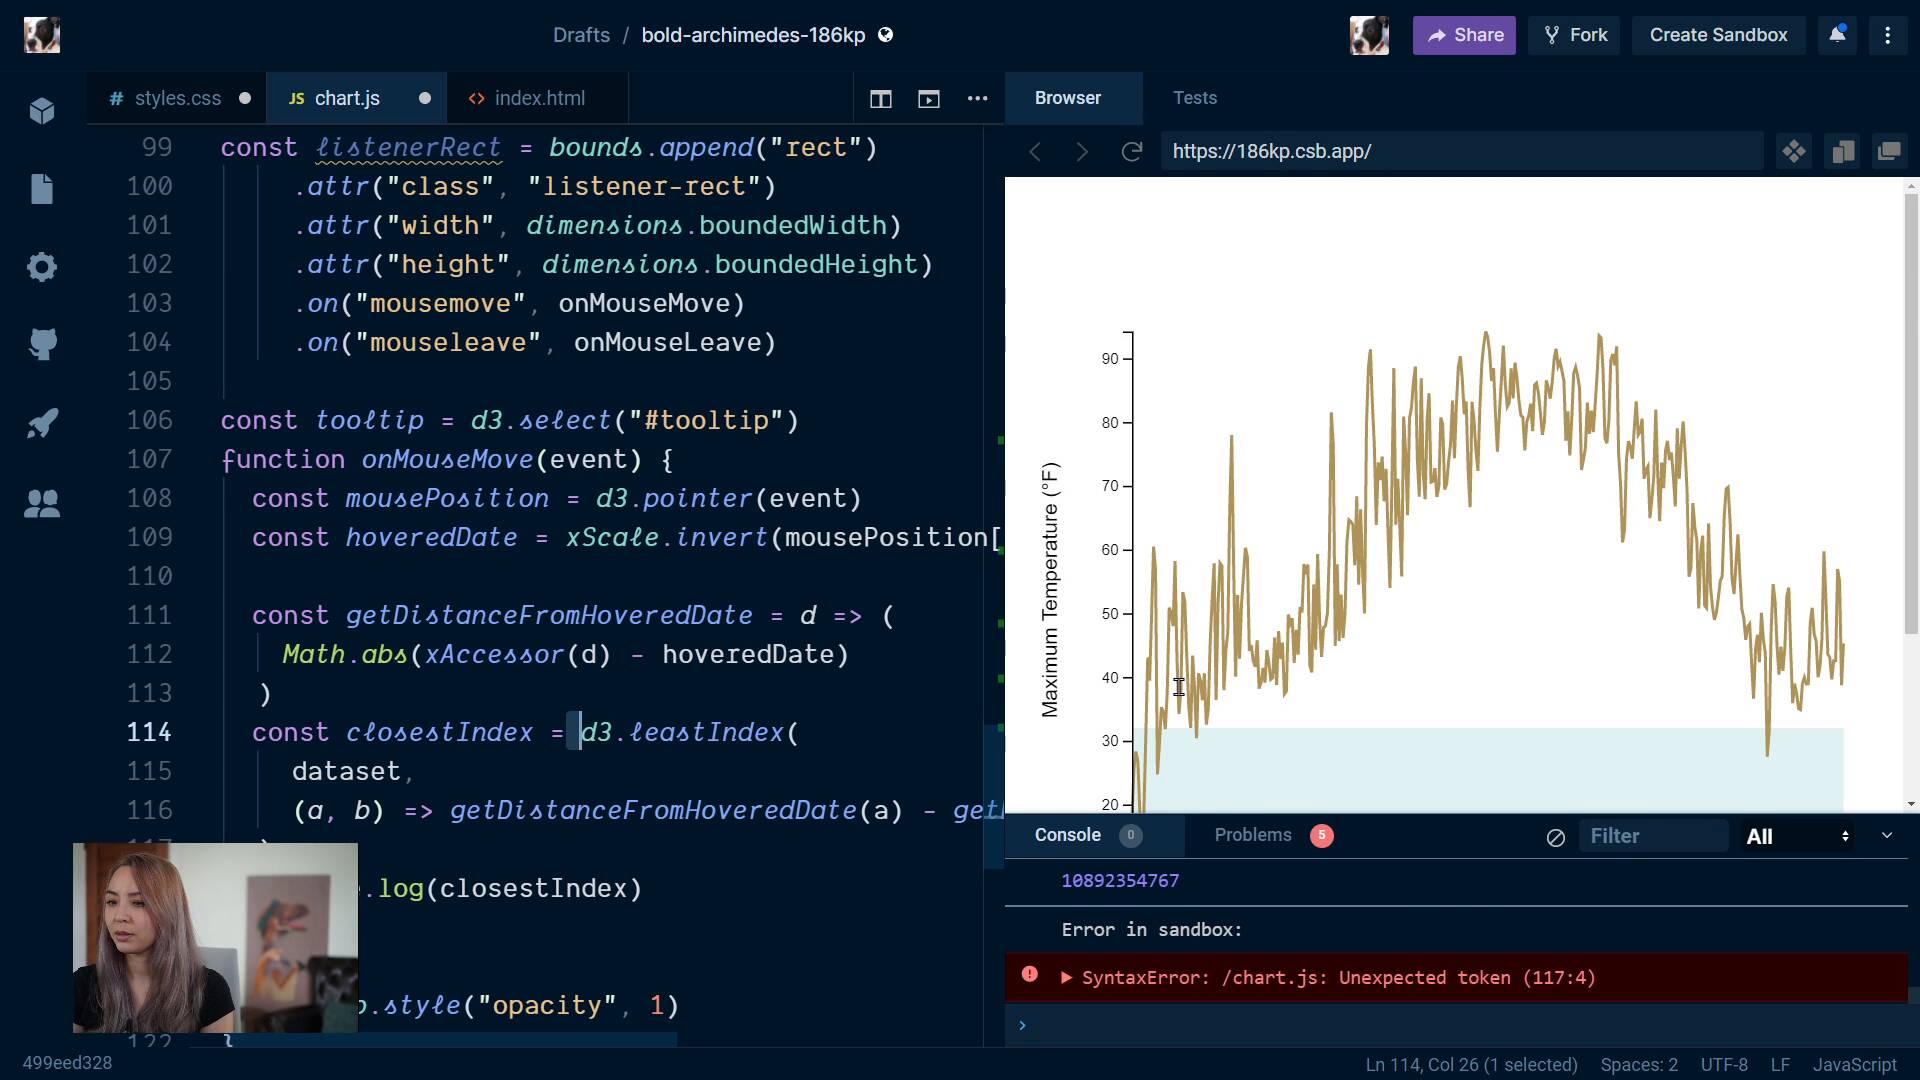
lesson
Line chartFullstack D3 MasterclassLastly, we add a tooltip to our timeline. We talk about how to add a listener rectangle, d3.leastIndex(), and how to add a dot to mark our place.
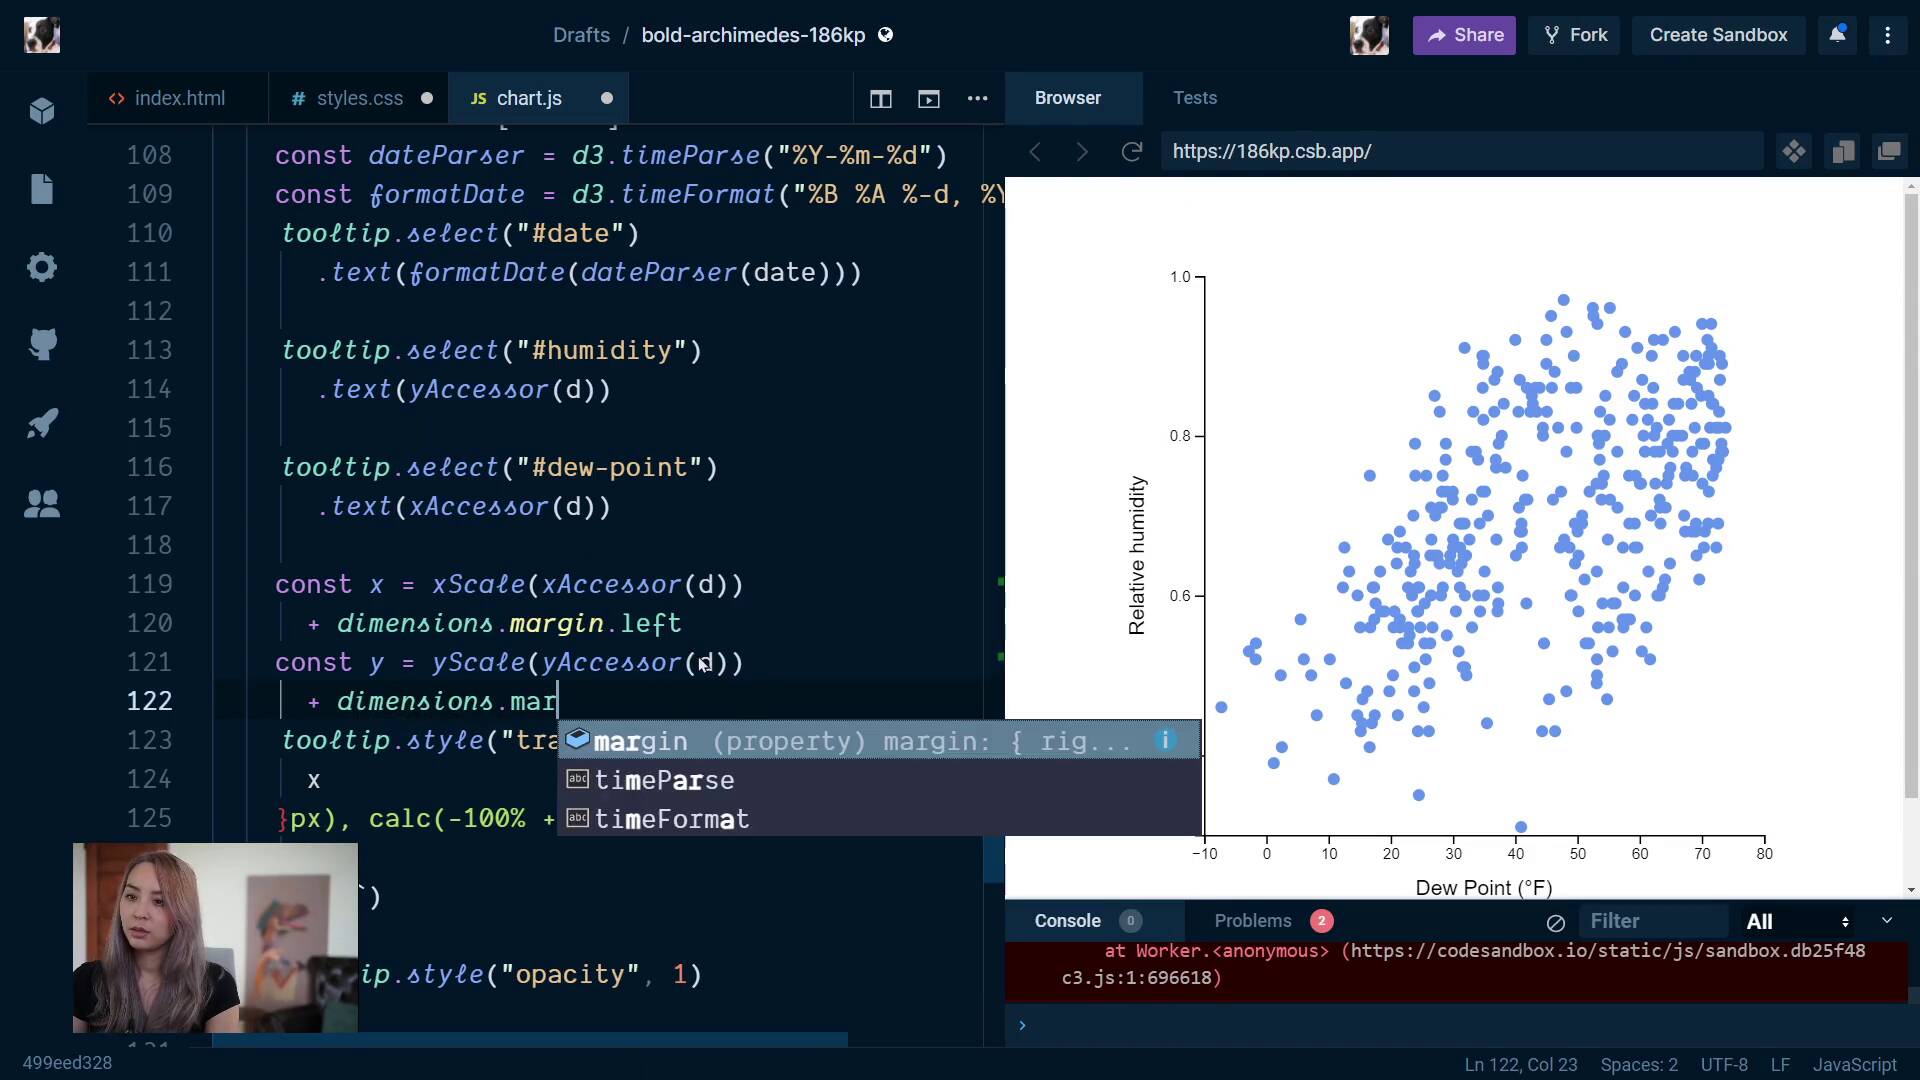
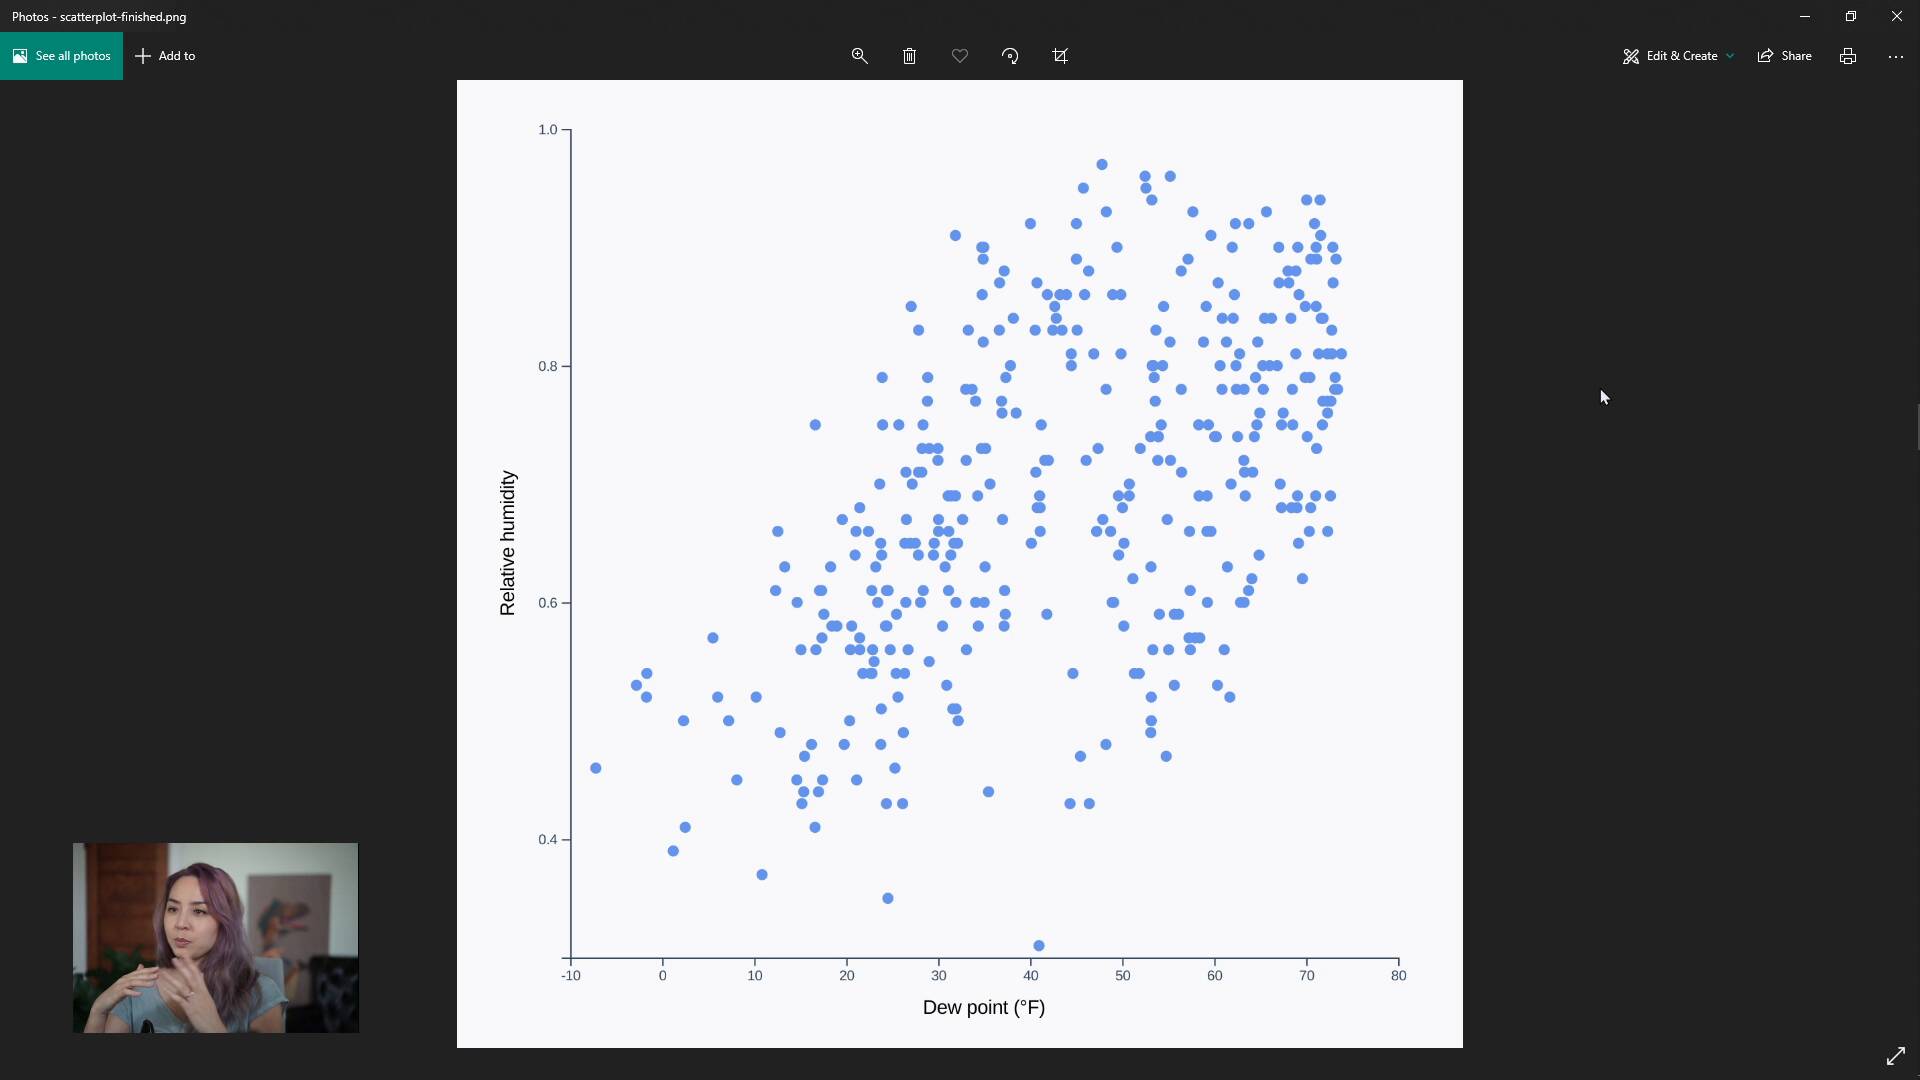
lesson
Scatter plotFullstack D3 MasterclassWe add a tooltip to our scatter plot. Along the way, we learn about d3.timeFormat and learn a great trick for making our tooltips feel smoother, using voronoi.

lesson
Bar chartFullstack D3 MasterclassWe add a tooltip to our histogram. This involves creating a tooltip, updating its contents to show information about the hovered bar, and moving above the hovered bar.
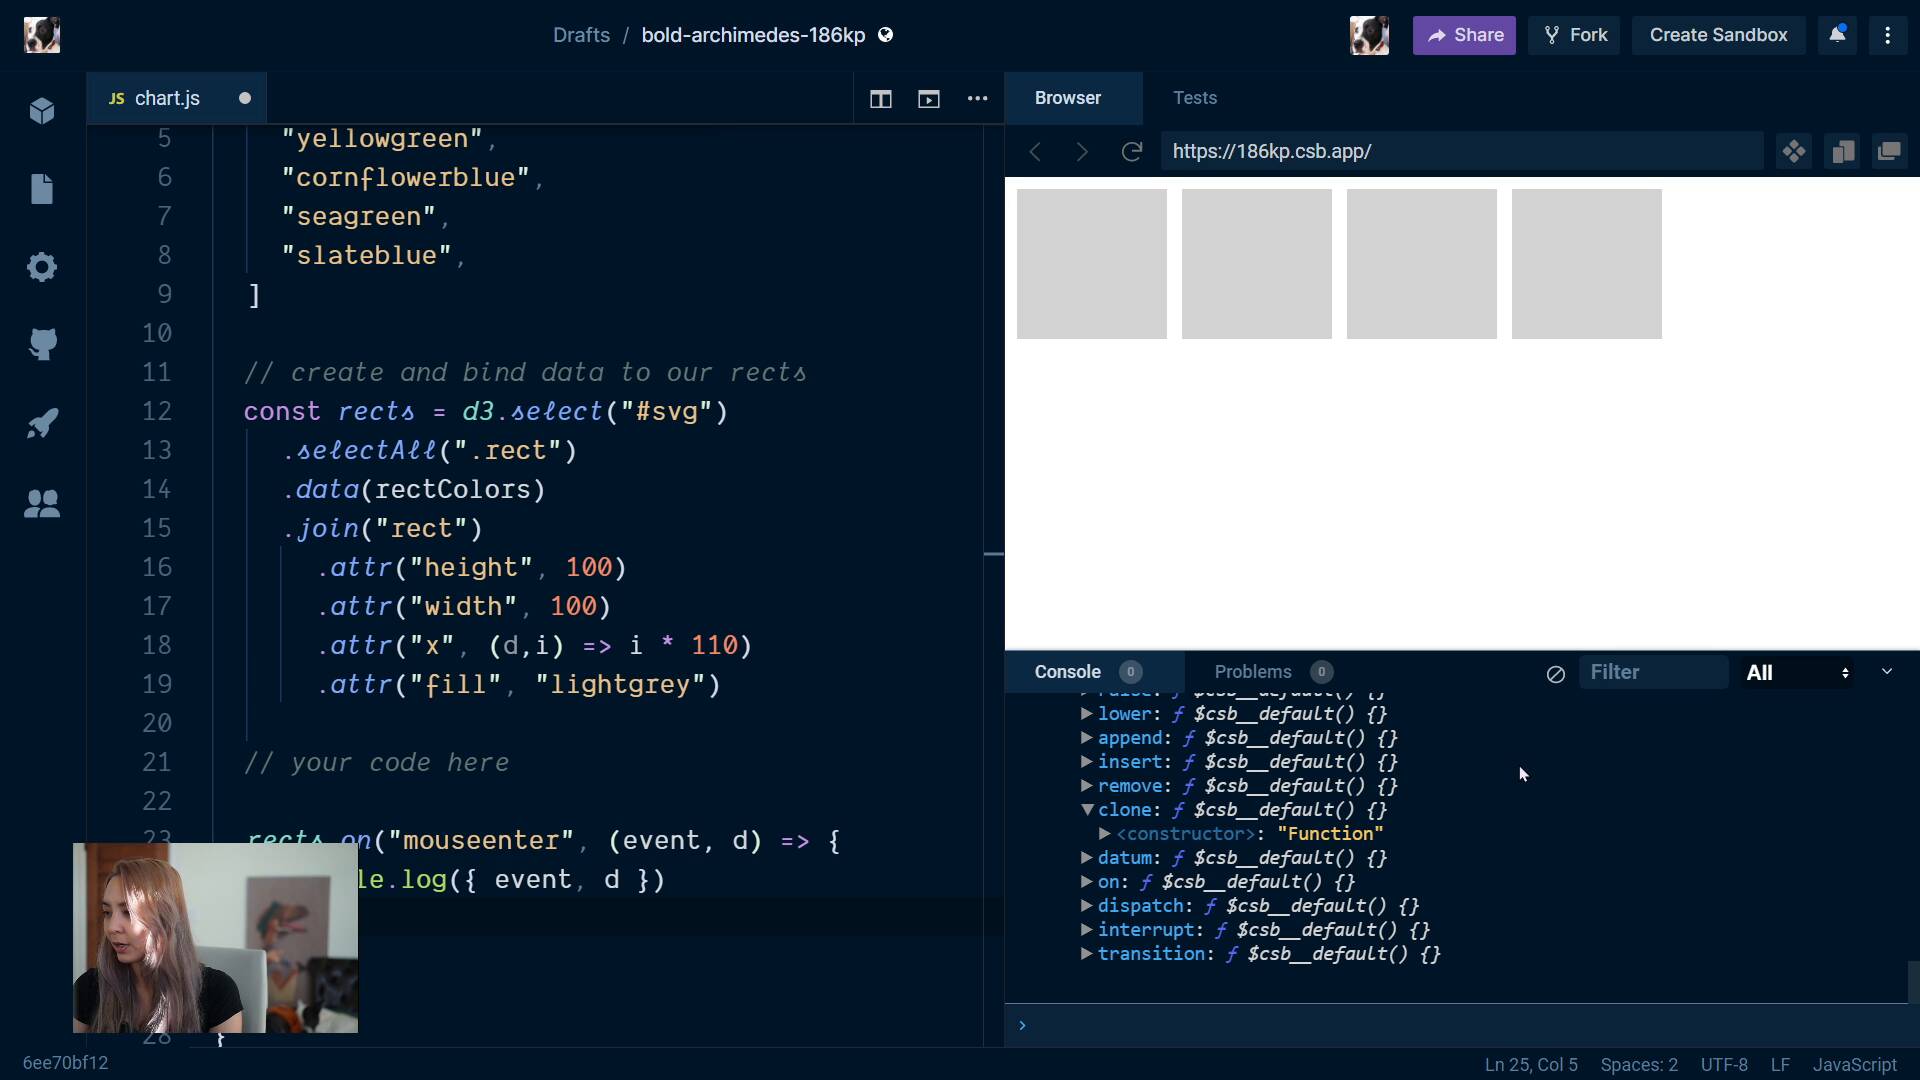
lesson
d3 eventsFullstack D3 MasterclassWe learn how to add interaction event listeners using our d3 selection objects, then run through a concrete example.