


This is a really great book. I will be using it for teaching, as I am currently developing a lot with D3, for my work at the university.
Florian Grassinger
Junior Researcher at University of Applied Sciences, FH St. Pölten
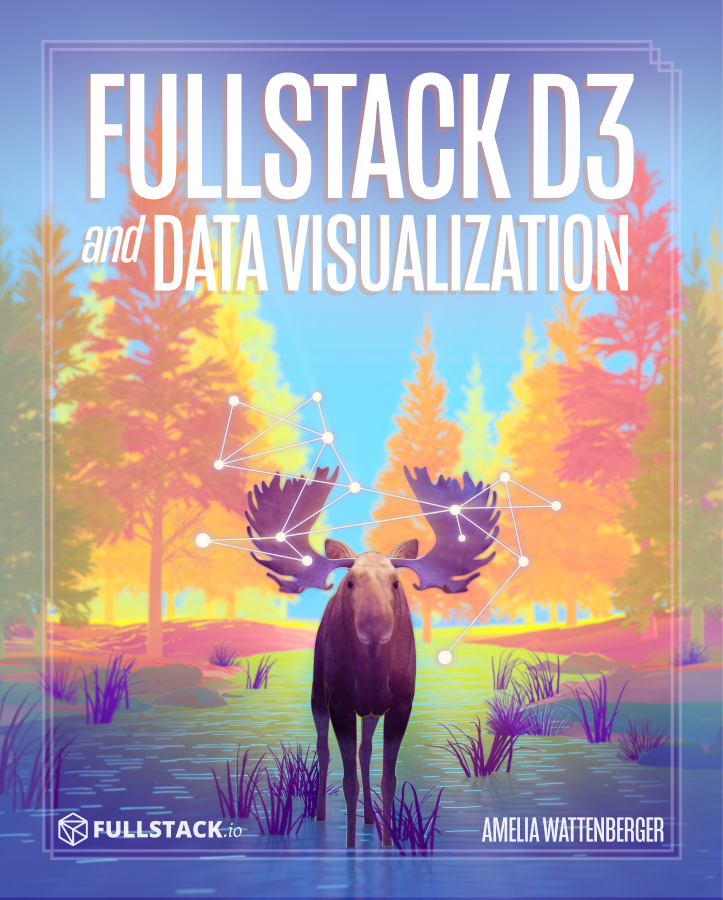
Fullstack D3 is a self-paced, online course where you will learn how to master D3 and build beautiful, custom visualizations
Take the course anywhere
Take the course anytime
Learn in a cohesive fashion
Learn with other students
When I turned to d3, the learning curve felt so steep. But this course is a great catalyst for learning d3js.
I've always had trouble translating what is in my head onto the screen but I feel more confident creating my own things now

I'm a front-end developer at The Pudding
Over the past ten years that I've been visualizing data, I've been perfecting my method and collecting helpful tricks. I'm here to jump-start your own journey!
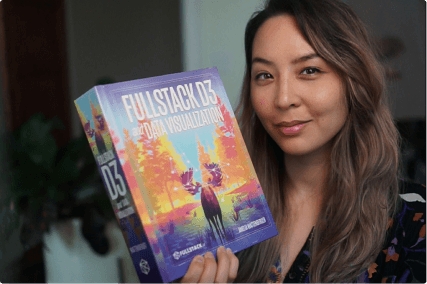
In Fullstack D3 and Data Visualization, I distill my hard-earned knowledge into bite-sized lessons.
We'll start making charts right away, and learn new concepts and design theory as we go.

[{"time": 1514782800, "summary": "Clear throughout the day.", "icon": "clear-day", "sunriseTime": 1514809280, "sunsetTime": 1514842810, "moonPhase": 0.48, "precipIntensity": 0, "precipIntensityMax": 0, "precipProbability": 0, "temperatureHigh": 18.39, "temperatureHighTime": 1514836800, "temperatureLow": 12.23, "temperatureLowTime": 1514894400, "apparentTemperatureHigh": 17.29, "apparentTemperatureHighTime": 1514844000, "apparentTemperatureLow": 4.51, "apparentTemperatureLowTime": 1514887200, "dewPoint": -1.67, "humidity": 0.54, "pressure": 1028.26, "windSpeed": 4.16, "windGust": 13.98, "windGustTime": 1514829600, "windBearing": 309, "cloudCover": 0.02, "uvIndex": 2, "uvIndexTime": 1514822400, "visibility": 10, "temperatureMin": 6.17, "temperatureMinTime": 1514808000, "temperatureMax": 18.39, "temperatureMaxTime": 1514836800, "apparentTemperatureMin": -2.19, "apparentTemperatureMinTime": 1514808000, "apparentTemperatureMax": 17.29, "apparentTemperatureMaxTime": 1514844000, "date": "2018-01-01"}, {"time": 1514869200, "summary": "Clear throughout the day.", "icon": "clear-day", "sunriseTime": 1514895684, "sunsetTime": 1514929260, "moonPhase": 0.52, "precipIntensity": 0, "precipIntensityMax": 0, "precipProbability": 0, "temperatureHigh": 25.79, "temperatureHighTime": 1514923200, "temperatureLow": 12.65, "temperatureLowTime": 1514980800, "apparentTemperatureHigh": 20.13, "apparentTemperatureHighTime": 1514923200, "apparentTemperatureLow": 12.1, "apparentTemperatureLowTime": 1514944800, "dewPoint": 5.51, "humidity": 0.57, "pressure": 1028.58, "windSpeed": 4.71, "windGust": 12.25, "windGustTime": 1514912400, "windBearing": 266, "cloudCover": 0.05, "uvIndex": 2, "uvIndexTime": 1514908800, "visibility": 10, "temperatureMin": 12.23, "temperatureMinTime": 1514894400, "temperatureMax": 25.79, "temperatureMaxTime": 1514923200, "apparentTemperatureMin": 4.51, "apparentTemperatureMinTime": 1514887200, "apparentTemperatureMax": 20.13, "apparentTemperatureMaxTime": 1514923200, "date": "2018-01-02"}, {"time": 1514955600, "summary": "Mostly cloudy starting in the evening.", "icon": "partly-cloudy-night", "sunriseTime": 1514982086, "sunsetTime": 1515015712, "moonPhase": 0.56, "precipIntensity": 0, "precipIntensityMax": 0, "precipProbability": 0, "temperatureHigh": 28.32, "temperatureHighTime": 1515009600, "temperatureLow": 23.46, "temperatureLowTime": 1515070800, "apparentTemperatureHigh": 28.32, "apparentTemperatureHighTime": 1515009600, "apparentTemperatureLow": 14.28, "apparentTemperatureLowTime": 1515070800, "dewPoint": 6.03, "humidity": 0.52, "pressure": 1024.79, "windSpeed": 0.64, "windGust": 5, "windGustTime": 1514955600, "windBearing": 254, "cloudCover": 0.13, "uvIndex": 2, "uvIndexTime": 1514995200, "visibility": 10, "temperatureMin": 12.65, "temperatureMinTime": 1514980800, "temperatureMax": 28.32, "temperatureMaxTime": 1515009600, "apparentTemperatureMin": 12.65, "apparentTemperatureMinTime": 1514980800, "apparentTemperatureMax": 28.32, "apparentTemperatureMaxTime": 1515009600, "date": "2018-01-03"}, {"time": 1515042000, "summary": "Foggy until afternoon.", "icon": "fog", "sunriseTime": 1515068486, "sunsetTime": 1515102166, "moonPhase": 0.6, "precipIntensity": 0.0001, "precipIntensityMax": 0.0005, "precipIntensityMaxTime": 1515088800, "precipProbability": 0.06, "precipAccumulation": 0.032, "precipType": "snow", "temperatureHigh": 24.09, "temperatureHighTime": 1515110400, "temperatureLow": 8.86, "temperatureLowTime": 1515157200, "apparentTemperatureHigh": 15.76, "apparentTemperatureHighTime": 1515067200, "apparentTemperatureLow": -2.83, "apparentTemperatureLowTime": 1515157200, "dewPoint": 16.64, "humidity": 0.75, "pressure": 999.78, "windSpeed": 7.31, "windGust": 24.33, "windGustTime": 1515099600, "windBearing": 334, "cloudCover": 0.98, "uvIndex": 1, "uvIndexTime": 1515078000, "visibility": 5.01, "temperatureMin": 19.8, "temperatureMinTime": 1515124800, "temperatureMax": 26.62, "temperatureMaxTime": 1515052800, "apparentTemperatureMin": 9.16, "apparentTemperatureMinTime": 1515124800, "apparentTemperatureMax": 25.83, "apparentTemperatureMaxTime": 1515042000, "date": "2018-01-04"}, {"time": 1515128400, "summary": "Clear throughout the day.", "icon": "clear-day", "sunriseTime": 1515154884, "sunsetTime": 1515188621, "moonPhase": 0.63, "precipIntensity": 0, "precipIntensityMax": 0, "precipProbability": 0, "temperatureHigh": 15.36, "temperatureHighTime": 1515182400, "temperatureLow": 7.4, "temperatureLowTime": 1515240000, "apparentTemperatureHigh": 4.56, "apparentTemperatureHighTime": 1515189600, "apparentTemperatureLow": -3.15, "apparentTemperatureLowTime": 1515243600, "dewPoint": -1.71, "humidity": 0.52, "pressure": 1009.75, "windSpeed": 8.06, "windGust": 21.82, "windGustTime": 1515182400, "windBearing": 290, "cloudCover": 0.13, "uvIndex": 2, "uvIndexTime": 1515168000, "visibility": 9.87, "temperatureMin": 8.86, "temperatureMinTime": 1515157200, "temperatureMax": 18.65, "temperatureMaxTime": 1515128400, "apparentTemperatureMin": -2.83, "apparentTemperatureMinTime": 1515157200, "apparentTemperatureMax": 8.19, "apparentTemperatureMaxTime": 1515128400, "date": "2018-01-05"}, {"time": 1515214800, "summary": "Clear throughout the day.", "icon": "clear-day", "sunriseTime": 1515241279, "sunsetTime": 1515275077, "moonPhase": 0.67, "precipIntensity": 0, "precipIntensityMax": 0, "precipProbability": 0, "temperatureHigh": 13.02, "temperatureHighTime": 1515268800, "temperatureLow": 3.68, "temperatureLowTime": 1515330000, "apparentTemperatureHigh": 2.1, "apparentTemperatureHighTime": 1515272400, "apparentTemperatureLow": -4.08, "apparentTemperatureLowTime": 1515304800, "dewPoint": -7.22, "humidity": 0.46, "pressure": 1023.97, "windSpeed": 6.44, "windGust": 18.09, "windGustTime": 1515218400, "windBearing": 294, "cloudCover": 0.03, "uvIndex": 2, "uvIndexTime": 1515254400, "visibility": 10, "temperatureMin": 6.62, "temperatureMinTime": 1515297600, "temperatureMax": 13.02, "temperatureMaxTime": 15
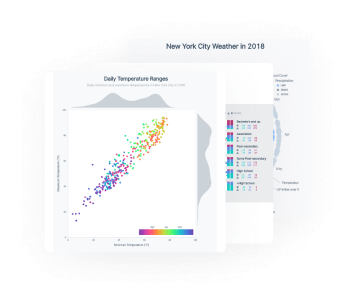
Charts communicate ideas with simplicity, clarity, and detail.
Once you're comfortable with D3 you can quickly:
Today, I will show you the exact methods I use to create beautiful, understandable data visualizations using D3.
This is the first book (on coding) that I actually learned something from and I built my first visualization within 30 minutes.
That took away a lot of my hesitation. I think you did an amazing job!
In this course, we're going to build all of these charts. Click on one to see more
I always dreamed of being a data journalist and, after this book, I'm going to start a data vis blog - Thank you!!
You need to build dashboards and you'd like to learn D3 as quickly and efficiently as possible.
You are responsible for turning data into information.
You want to quickly share the insights that you see with other people — without them getting lost in tables of numbers.
You know JavaScript.
You want a book chock full of practical guidance on how to create effective data visualizations with D3.
This is a really great book. I will be using it for teaching, as I am currently developing a lot with D3, for my work at the university.
This book reads really well. Generalizing code is not commonly addressed in D3 books geared towards beginners. Thank you for doing that Amelia! Great work!
I bought this book for a singular purpose and it delivered incredibly well. I saw an animation on the D3 gallery and wanted to learn how to make it. The Sankey Diagram chapter did not disappoint! I started from the beginning and worked myself up to that chapter and felt very confident building and adapting the interactive visualization once I got there.
Fullstack D3 does a nice job demonstrating that I can easily transform json into datapoints and that d3 is good for scaling and other transformations. Also, thanks for the beautiful react tutorials on you homepage!
I could use D3. JS pretty well, even before I got the book, but the Fullstack D3 book is a whole new experience for me. I like it a lot.
Fullstack D3 has been generally a fun & enjoyable read. It's a good balance of necessary detail to get the current work done with pointers to more investigative/curious folks to do as they please. Thanks for all your hard work putting this book together! Amelia's authorship is veryy enjoyable.
This is the first book (on coding) that I actually learned something from and I built my first visualisation within 30 minutes. That took away a lot of my hesitation. I think you did an amazing job!
Just did my first scrollytelling experiment using d3.js + javascript for scroll events! Can't believe it!!
This is a wonderful book you have written and I'm learning and enjoying it a lot. Fullstack D3 makes me think, I CAN learn this stuff.
This is, really, the best book on D3 that I have ever read. I've learned a lot.
Making a bar chart, chapter 3, was my favorite. I felt I was really learning it. After reading, I hope I will be able to make advanced visualizations on my own. I expect I can make them.
I used the book to help me in my online masters course for computer science program. I highly recommended your book to my fellow student colleagues because the book is very readable, fun and practical.
Fullstack D3 seems to cover all bases and provides enough information for the reader to build on what they have learned so far! With this book, I am learning to understand d3 and data visualisation. Several methods such as d3.min, d3.extent, etc are valuable to solve problems that I've written custom code for in the past.
The book is going great so far! I already created my first d3 viz here, https://twitter.com/Data_Stud/status/1211486869344665606?s=19.
When I turned to d3, the learning curve felt so steep. So far, the book is a great catalyst (in the lowering activation energy sense) for learning d3js. I've always had trouble translating what is in my head onto the screen. The starter code is great, and I feel more confident creating my own things now.
Great work! I’m really enjoying the book so far. Your writing style suits me well.
I always dreamed of being a data journalist and I am hoping after this book to start a data vis blog - Thank you!!
I've been looking at quite a bit of Amelia's work recently, particularly on her blog. It was the quality of her work on the state of JavaScript 2019 site that brought me to the Fullstack site and persuaded me to purchase this book. All her stuff is great.
Excellent book! Without a doubt, this absolutely sets the standard for on-boarding students new to D3. It's lucid, accessible, engaging, and fresh. Amelia did a superb job of going over the enter-exit-update pattern. Best of educational material I've consumed.
The course has been amazing so far! It has a great balance between educating about dataviz, explaining methodologies, and letting us know which bits are syntactic sugar. Loving the course!
Fullstack D3 is highly empowering to an autodidact such as myself. Describing join() early on in the book was a good idea. It made extending and experimenting with the examples of later chapters possible. The acquisition of real-life use-cases became more intuitive after gaining this concept; even without a data science background. I will be recommending this book to my fellows.
I really like that this book gets you creating a MVP chart within 1 chapter
Thank you for creating this resource. I tried picking up d3 about 5 years ago and had difficulty finding my footing. I finally came back to it this year, and walking through the book's concepts and examples has given me a solid base to move forward with my visualization ideas. The book has been a reliable reference for implementation details as I go forward.
Thank you for creating the best resource for D3 that I've experienced. It's multiple times better than anything else I've taken. I loved the separation of sourcing data, using a specific method to generate it, and then applying that generator where needed.
Before this book, I had a passing curiosity about D3 and data viz. Now I can't wait to wake up and find a way to incorporate it in my daily consulting. I loved having the ”why” behind the code and not just a dog and pony show with hard to understand examples. This book was awesome.
Thanks for this book. I'm actually doing a course on visual analytics at the University of the Andes Colombia, and this book is helping me understand the technical and theoretical parts.
I am absolutely loving this book - the pacing, details, and sidebars are fantastic. This is an amazing resource.
I was a D3 newbie, but couldn't wait to learn it. Now I understand why people in general say that D3 is quite difficult to learn. Lots of new concepts, but I made it through and I am still having fun! Amelia is a great teacher.
I love how the book is set it up so the reader makes a viz right away. I’ve learned a lot so far. This book will help me get over the hump with D3.
5+ hours of D3 video training from Amelia Wattenberger
You might be asking:
“Is this just another "pretty coffee table book"? I don't need another book that's filled with beautiful but useless information.”
Nope! This is a practical course that teaches you both the tooling and when to use it.
The world of data visualization books is often split into two groups:
What you need is something that is both full of beautiful, clear (and practically useful) charts, but also walks through every step necessary for creating real D3 charts - from empty folder to the browser.
“But I'm a programmer not a designer - What if my charts turn out ugly?”
In this book we cover design principles, do's-and-don'ts of design, and when to use certain kinds of charts. The result is that your charts will look great even if you have no formal training in creating visual information design. But more importantly: you'll understand how to communicate ideas with visualizations.
“Isn't D3 complicated? I need to get a dashboard up quickly! I don't have time to learn every corner of some confusing library.”
Fullstack D3 is not a reprint of the API docs - it's a practical guide to everything you need to create charts as quickly as possible. Within the first 10 minutes you'll be creating your own custom D3 charts. After reading the first few chapters you'll feel comfortable creating your own visualizations.
“Can I use D3 with my existing React / Angular / web app?”
Absolutely. The course comes with lessons and sample code on how to integrate D3 easily — and efficiently — into your existing application.
I really like the way Amelia outlines the steps in Making a Scatterplot. The steps frame it nicely when presented as a checklist.
Also, seeing free formed shapes being created was eye opening and really drew my attention.
Great job
Here are answers to some common questions
The book is a downloadable PDF, ePub, and Mobi along with example code zip that goes through the content.
The course - which includes a free copy of the book - is an online course with hours of video lessons from Amelia, walking through the lessons.
If you like to read, you may prefer the book. If you like to watch videos, and see how Amelia works, then you'll love the masterclass.
It depends on if you enroll in the course or buy the book only.
If you buy the course, you'll be given a login to newline where you watch the videos, download the code, read the manuscript, and add comments and ask questions.
If you buy the book, You'll be able to download the book and source code after checkout. You'll also receive an email from Gumroad giving you instructions on how to download it at any time.
In either case, you'll be given access to our community Discord channel where you can get help.
Yes, but you don't necessarily need to be an expert. We assume you know the basics of programming in JavaScript. We walk through every line of code on how to build the first few charts.
When joining the course, you'll be invited to our community Discord where you can chat with fellow students.
It depends. The masterclass and the book share material - so if you went through the entire book and already feel confident building custom D3 visualizations, then you may not need the masterclass.
However, if you only worked through a couple of chapters or you find you're a visual learner, you enjoy listening to a teacher, and you want to see, hands-on, how Amelia works -- then you will love the masterclass.
If you're unhappy with the course for any reason, just reach out to us and we'll give you a full refund. No risk involved.


Dig in and create your first D3 visualization within 10 minutes.
Click the button below to get started.
Jump to purchase options


