


Lessons
view all ⭢
lesson
InteractionsFullstack D3 MasterclassLet's start talking about adding interactions to our charts!
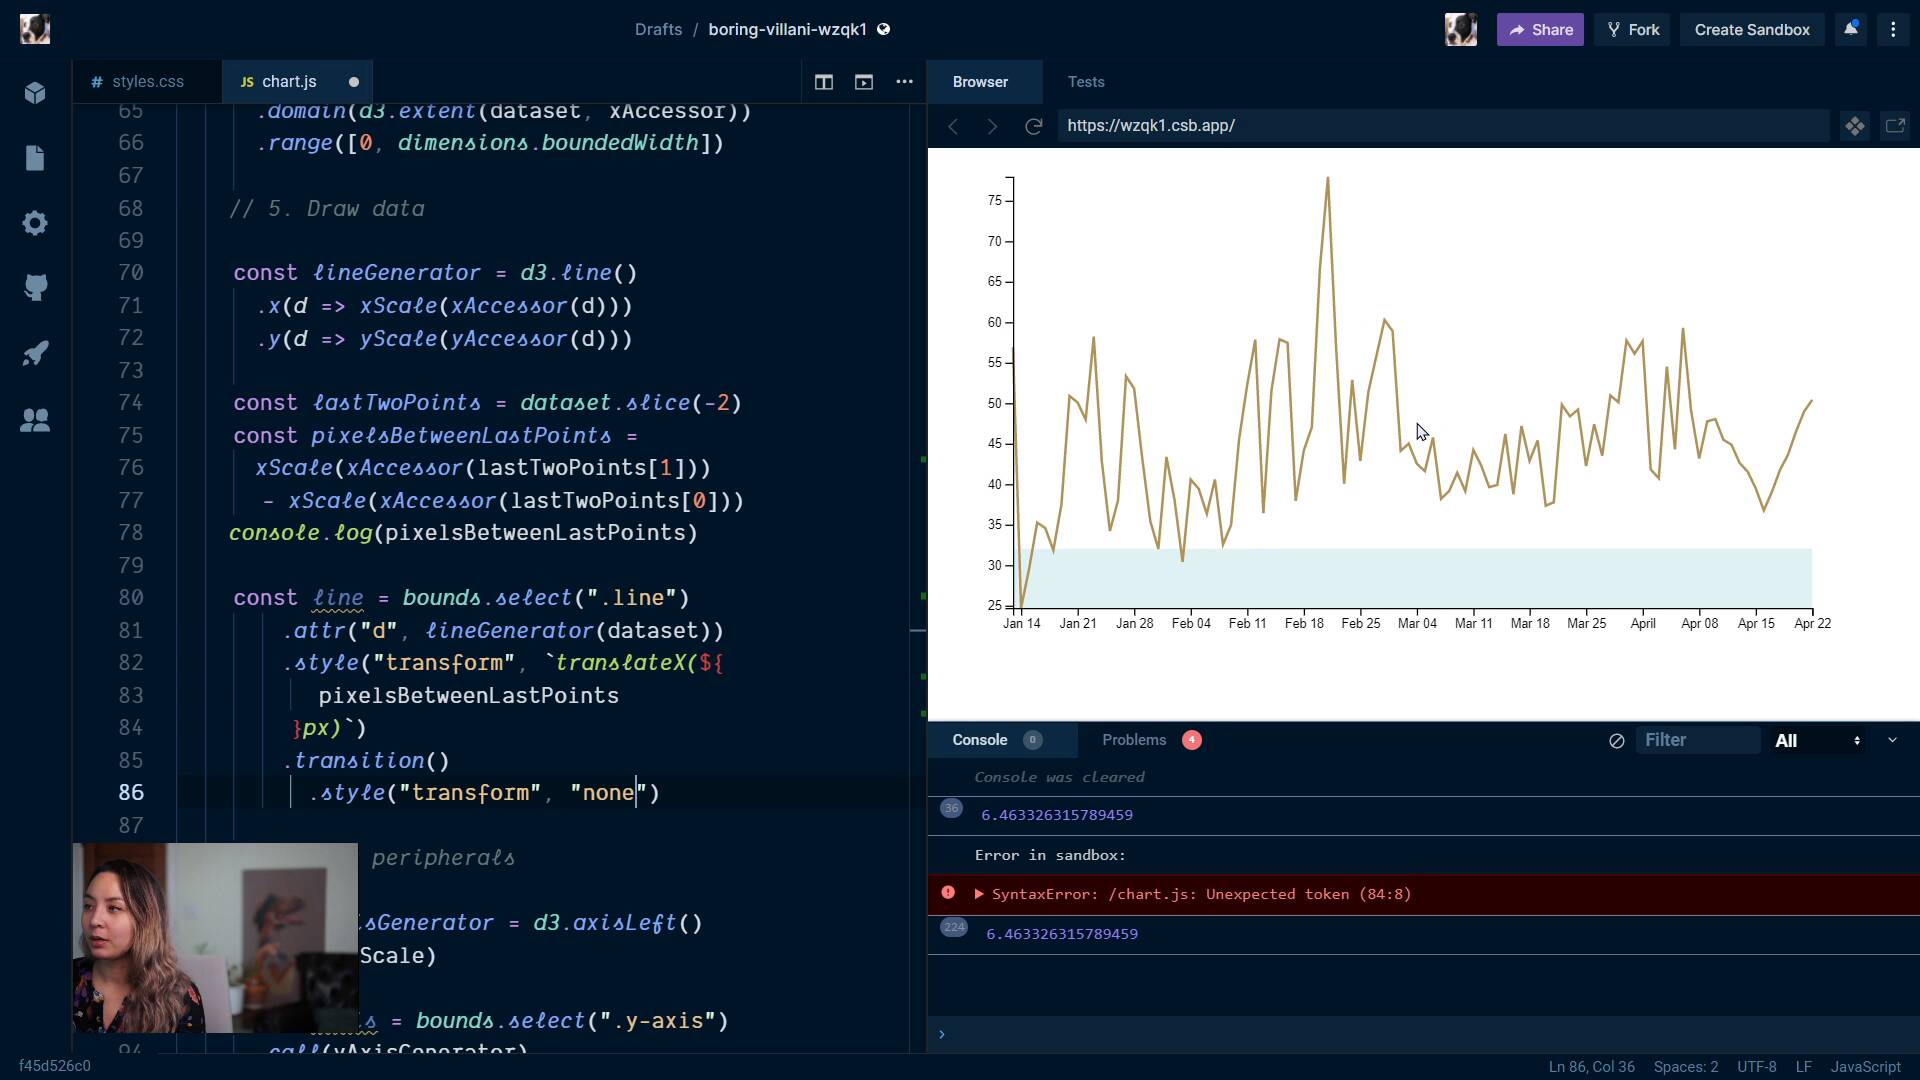
lesson
LinesFullstack D3 MasterclassWe talk through a more complex example: animating our line chart when it gets new data. This is trickier than it might seem at first!
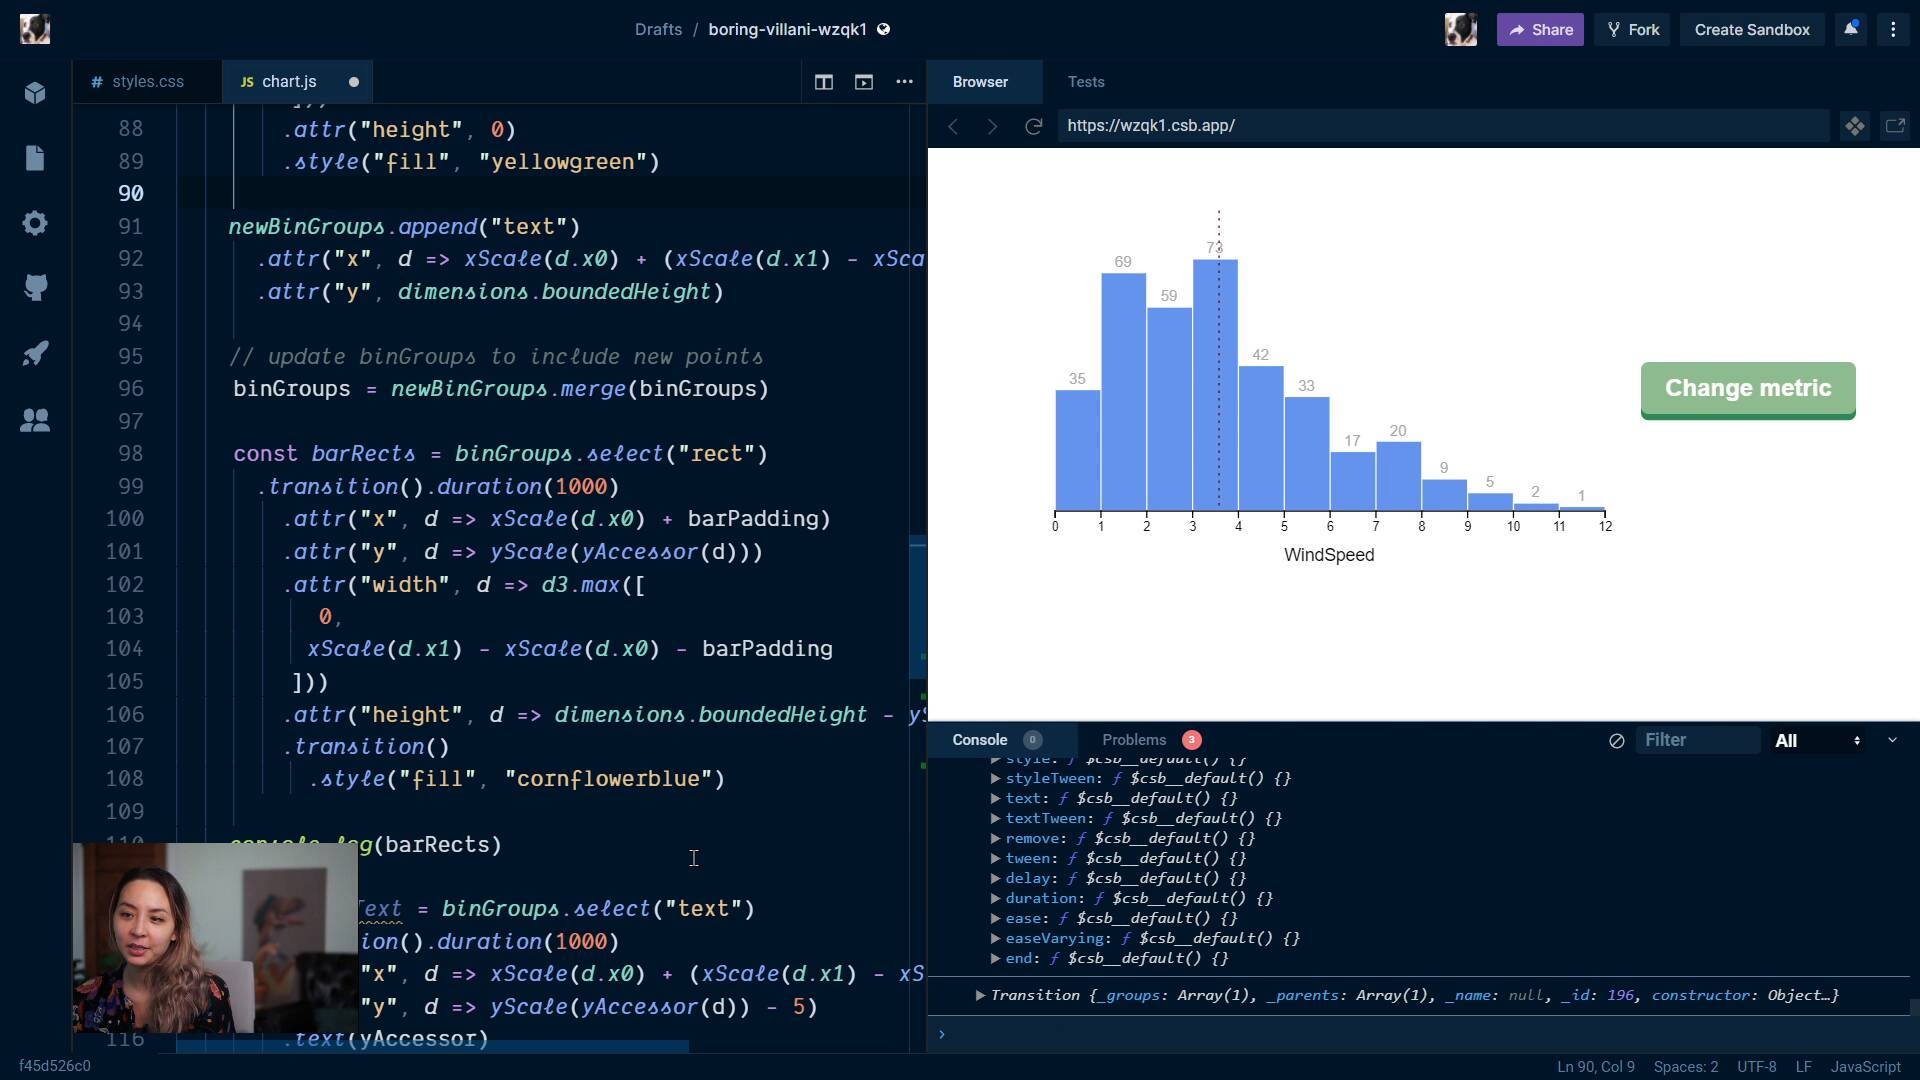
lesson
d3.transitionFullstack D3 MasterclassWe learn about d3.transition, and talk about when we would use it instead of CSS transitions. We then update our histogram to animate using d3.transition.
lesson
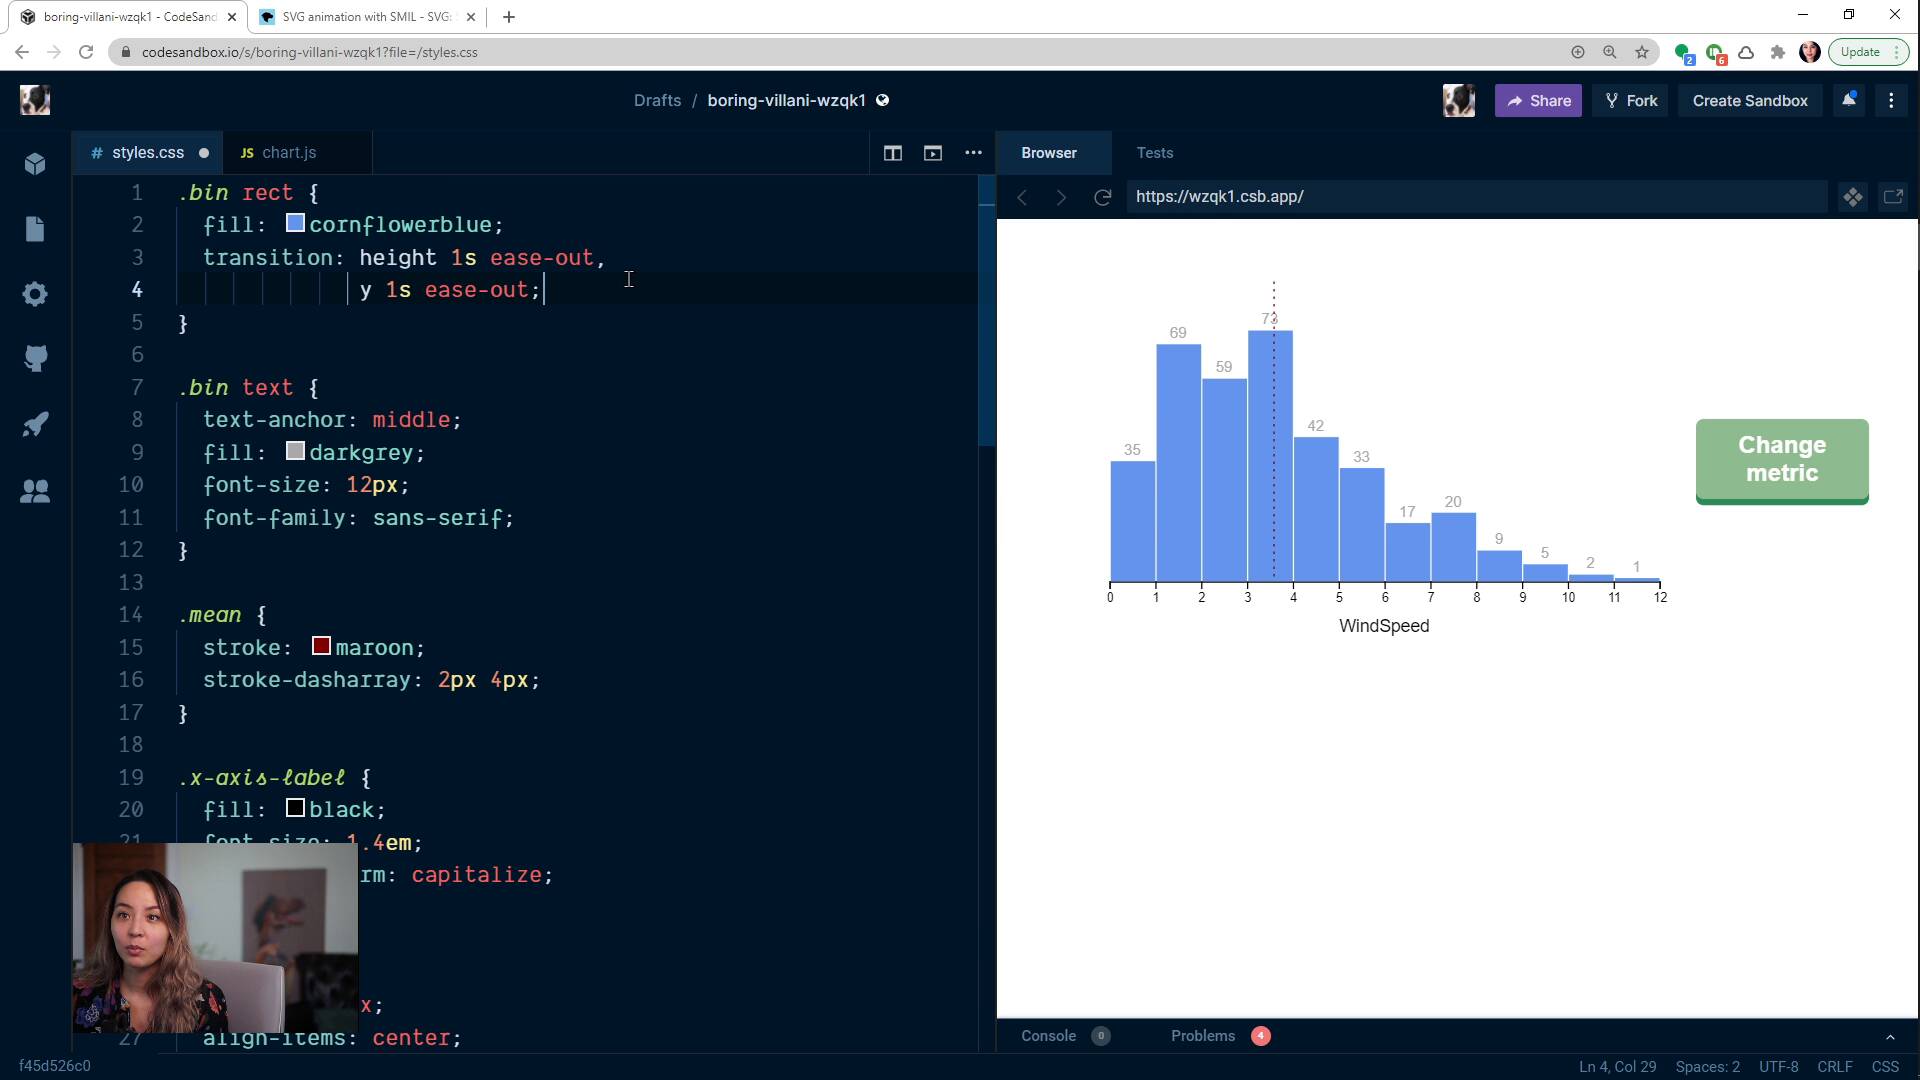
CSS transitions with a chartFullstack D3 MasterclassWe add CSS transitions to our histogram, animating changes as the bars change.

lesson
CSS transitionsFullstack D3 MasterclassWe learn about CSS transitions and the different CSS transition properties, then run through a concrete example and look at how to debug them.
lesson
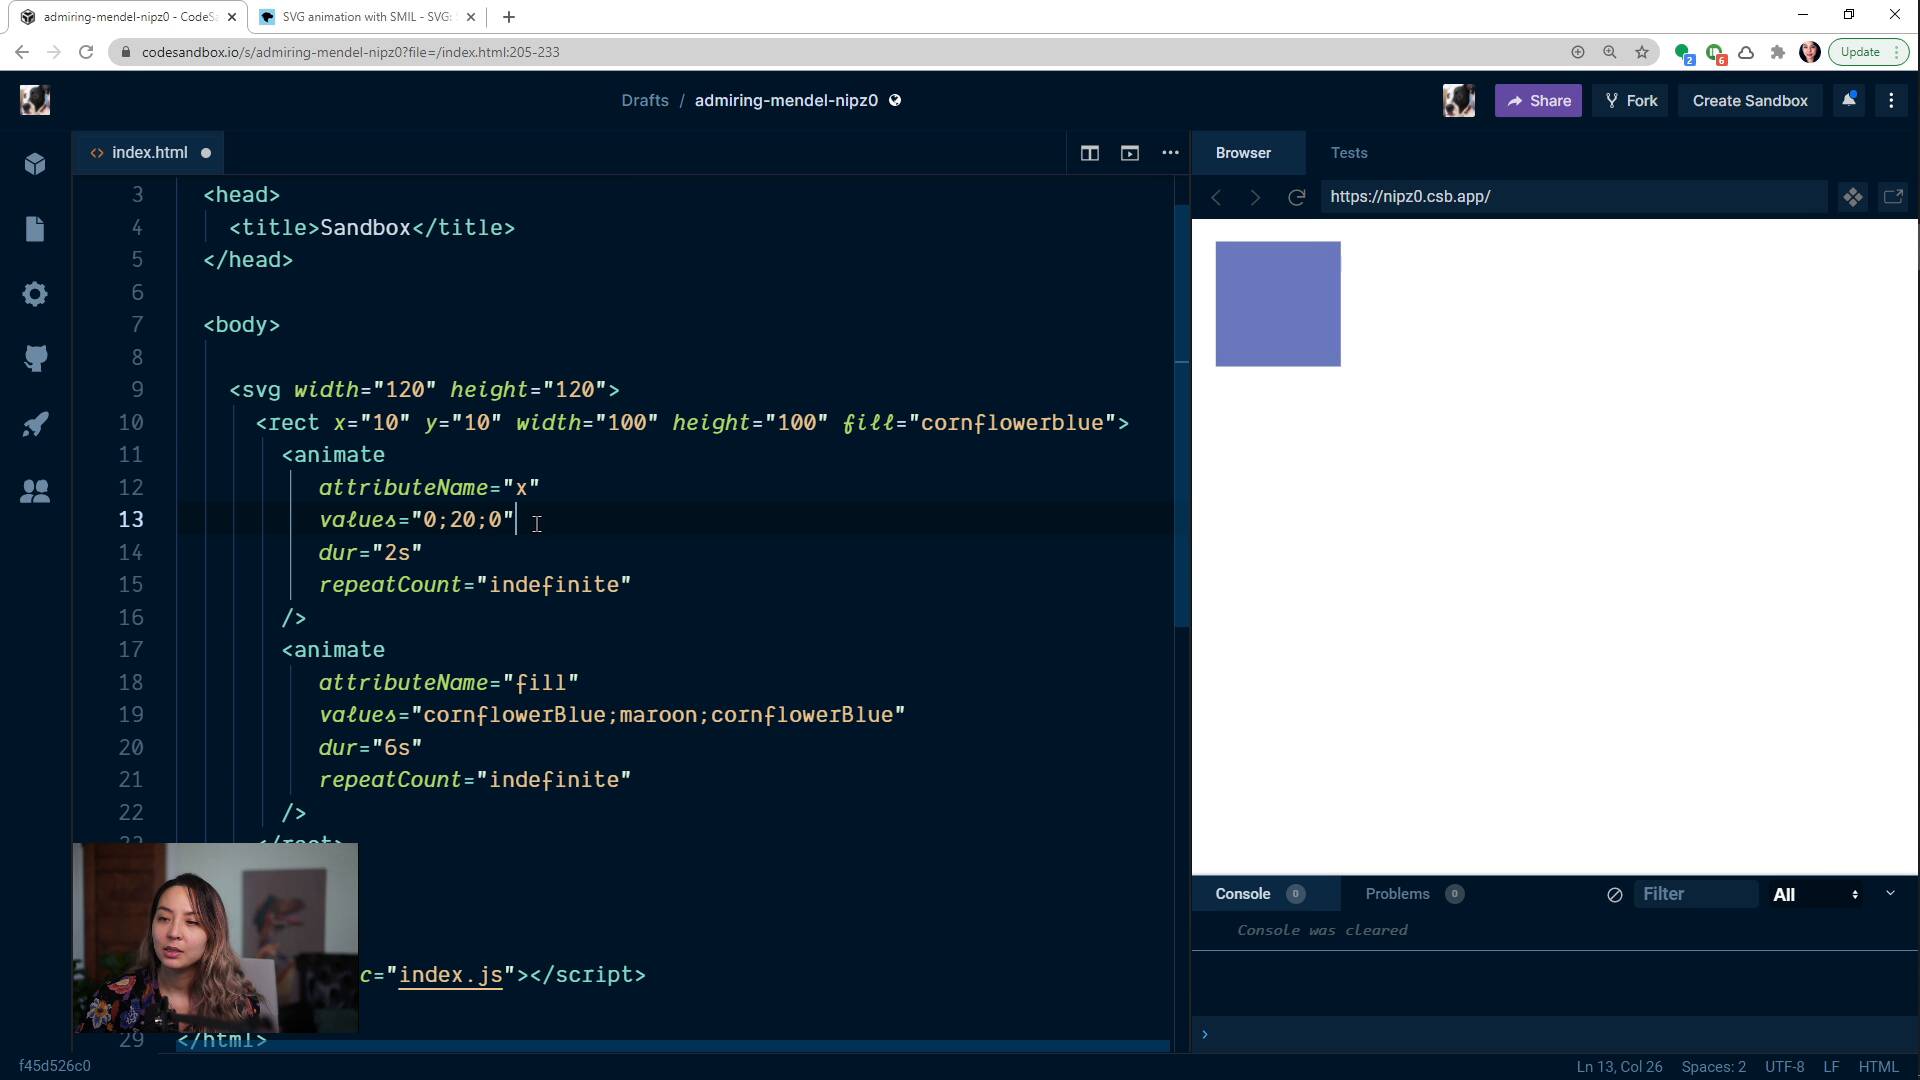
Animations and TransitionsFullstack D3 MasterclassWe talk about the different ways we can animate changes in our charts, and rule out SVG <animate>.
lesson
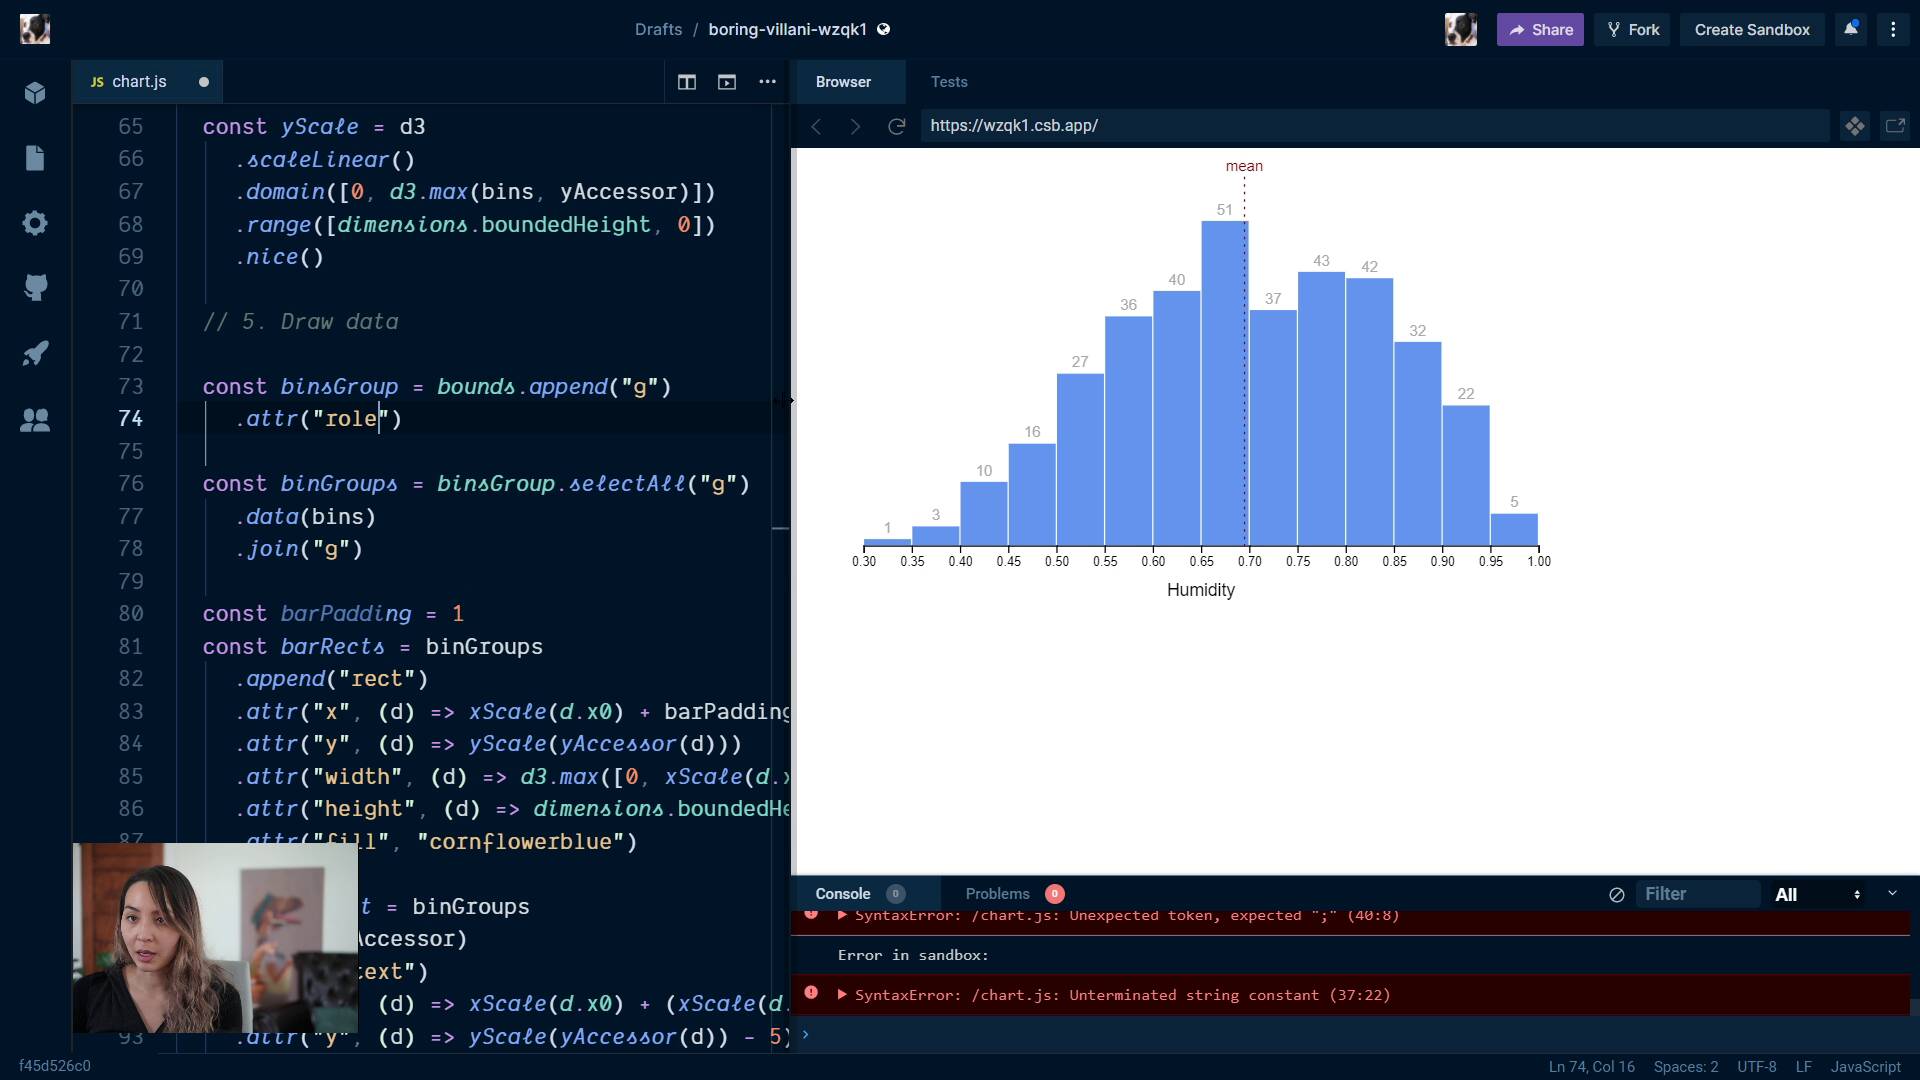
AccessibilityFullstack D3 MasterclassThis is a great lesson, and one that's hard to find good content on. We talk about the ways to make our charts accessible to screen readers, and walk through changing our histogram.
lesson
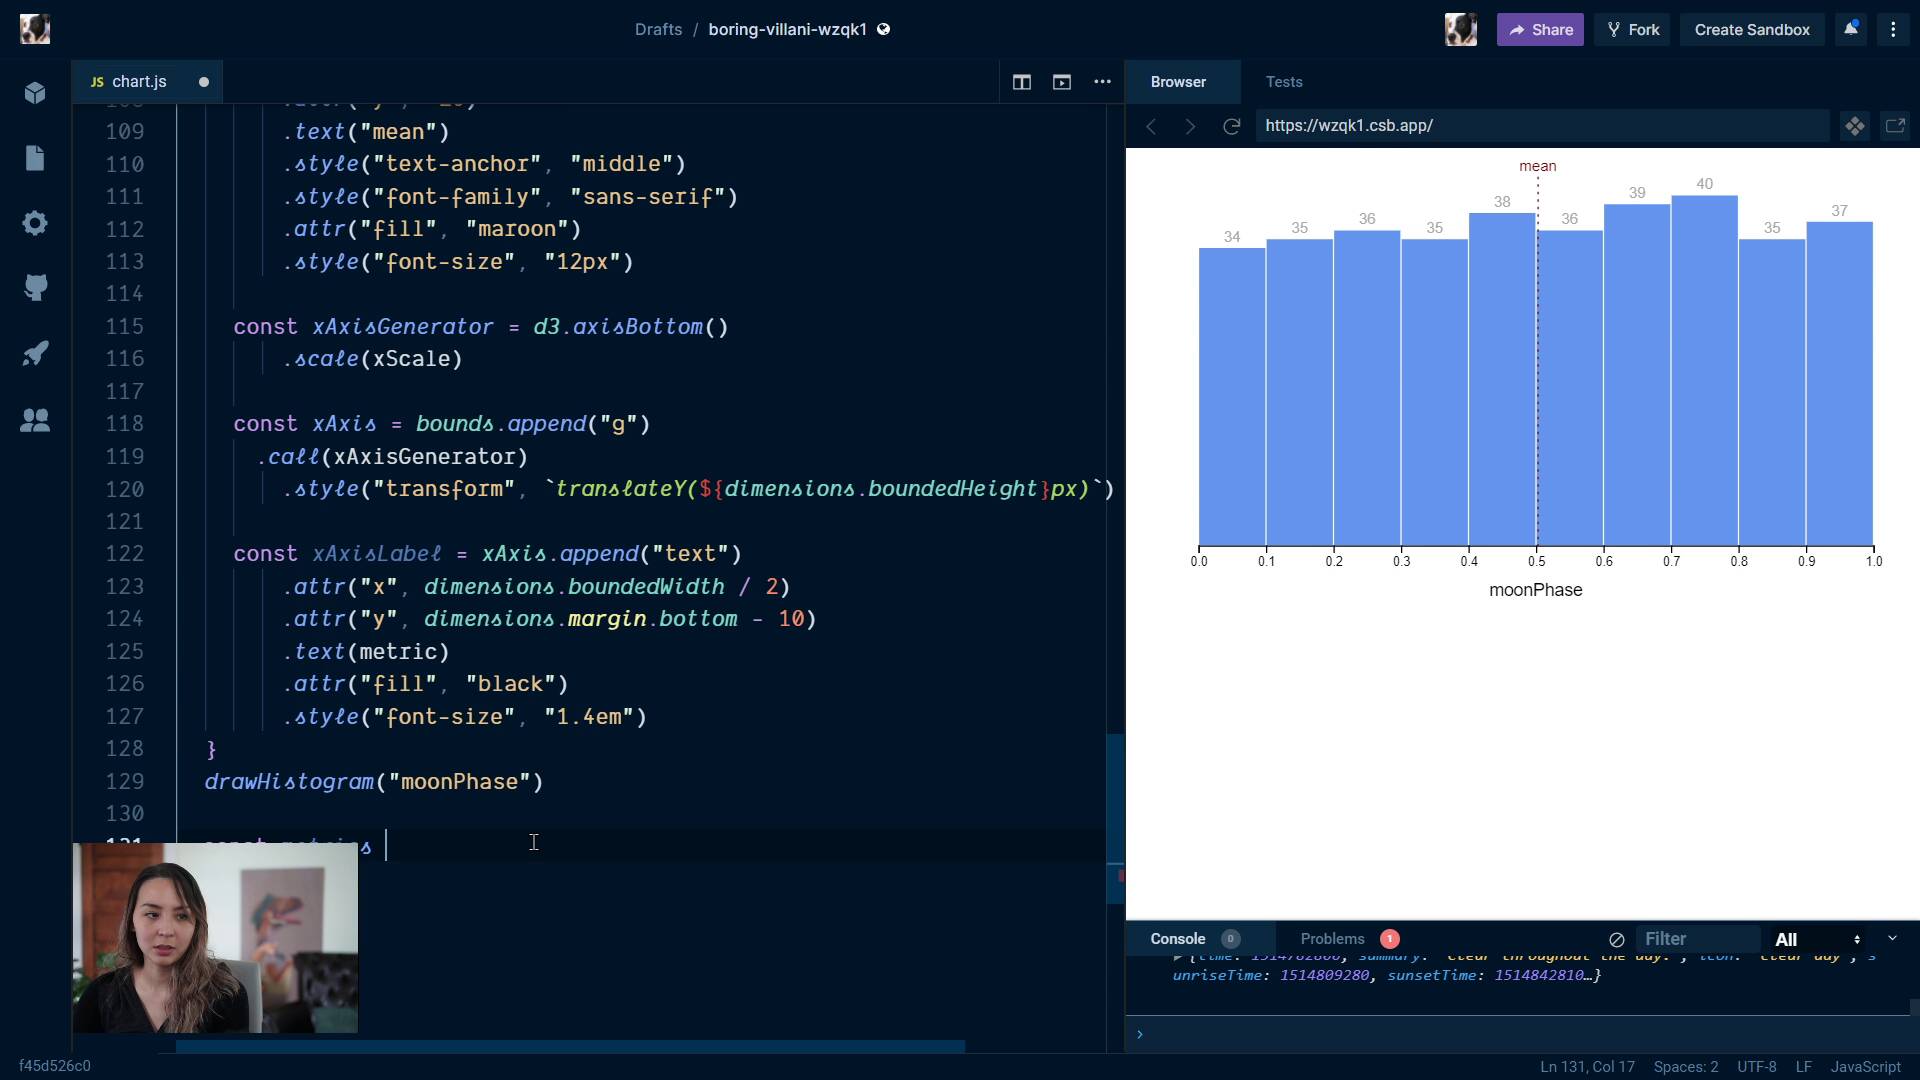
Extra creditFullstack D3 MasterclassWe talk about how to generalize our code, and change it so that we draw multiple histograms for different metrics.
lesson
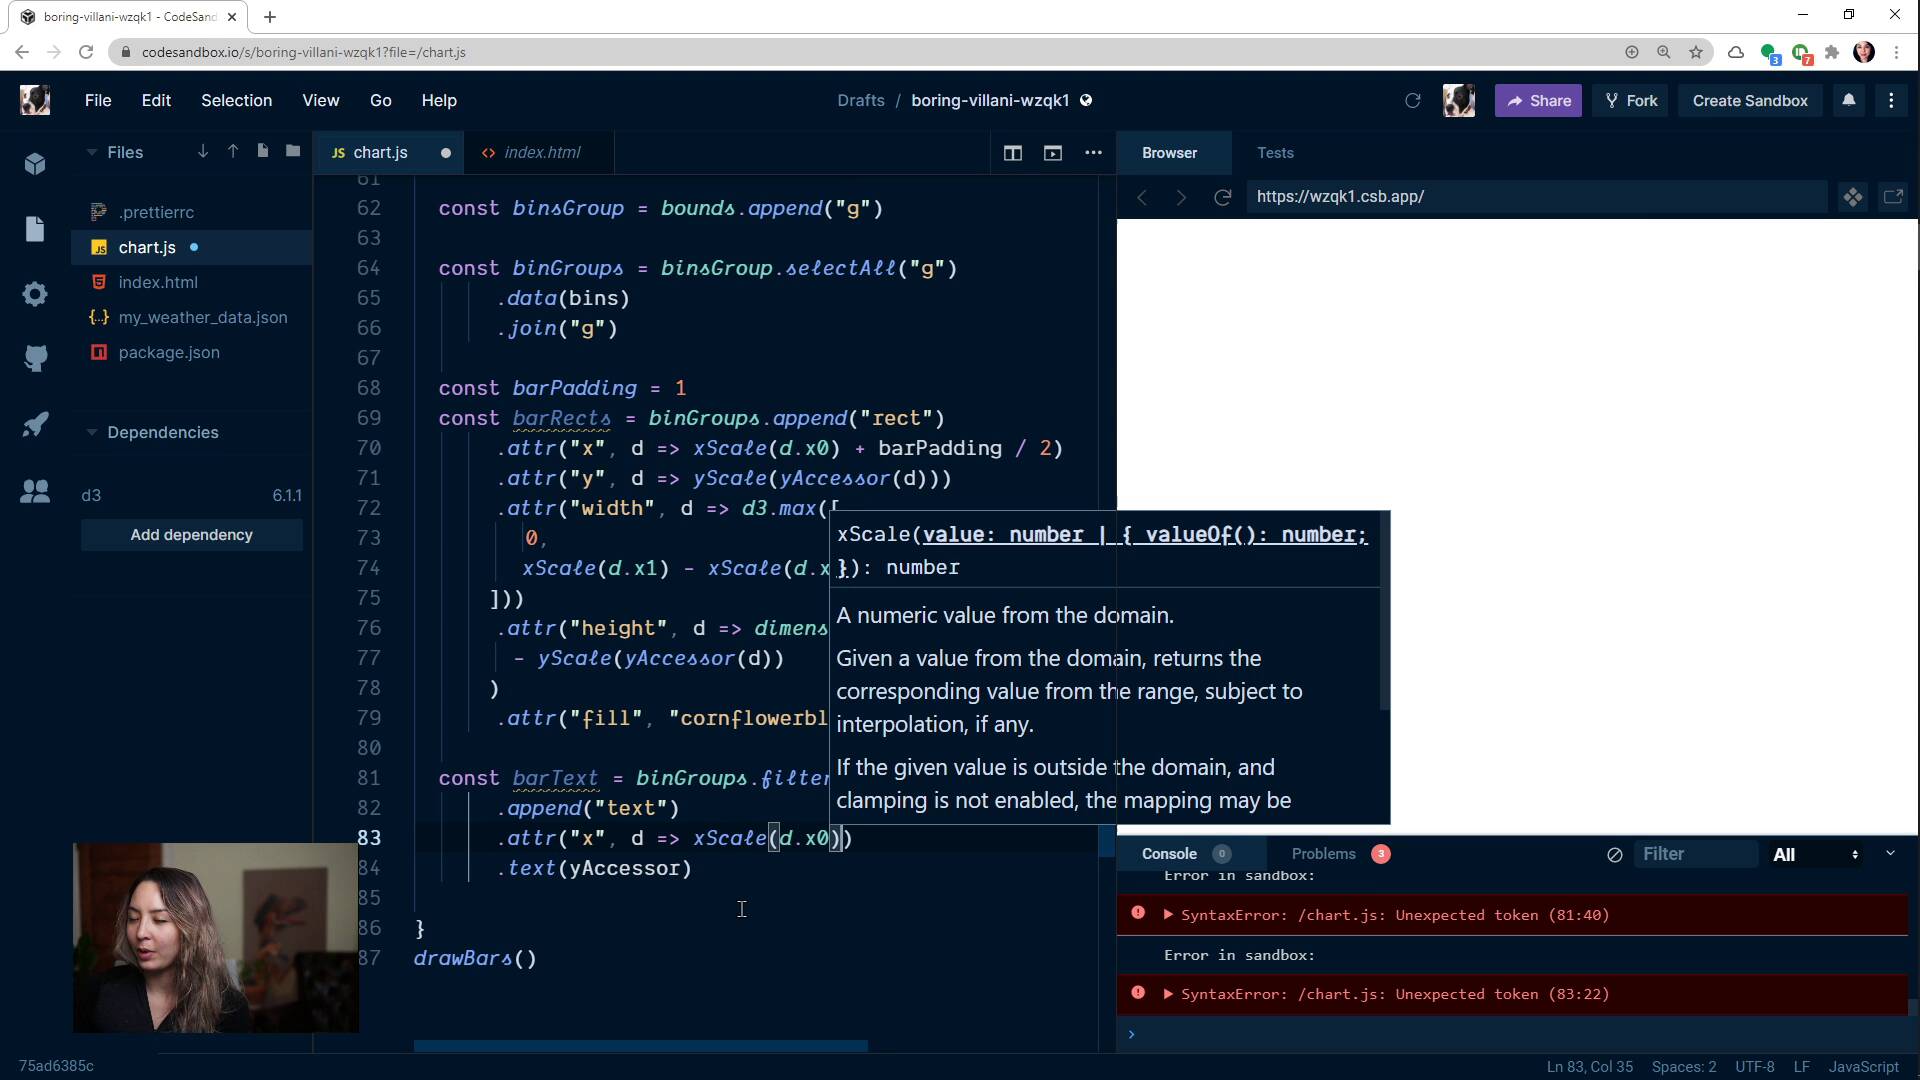
Adding LabelsFullstack D3 MasterclassWe draw a label over each bar, showing the number of points within that bin.
lesson
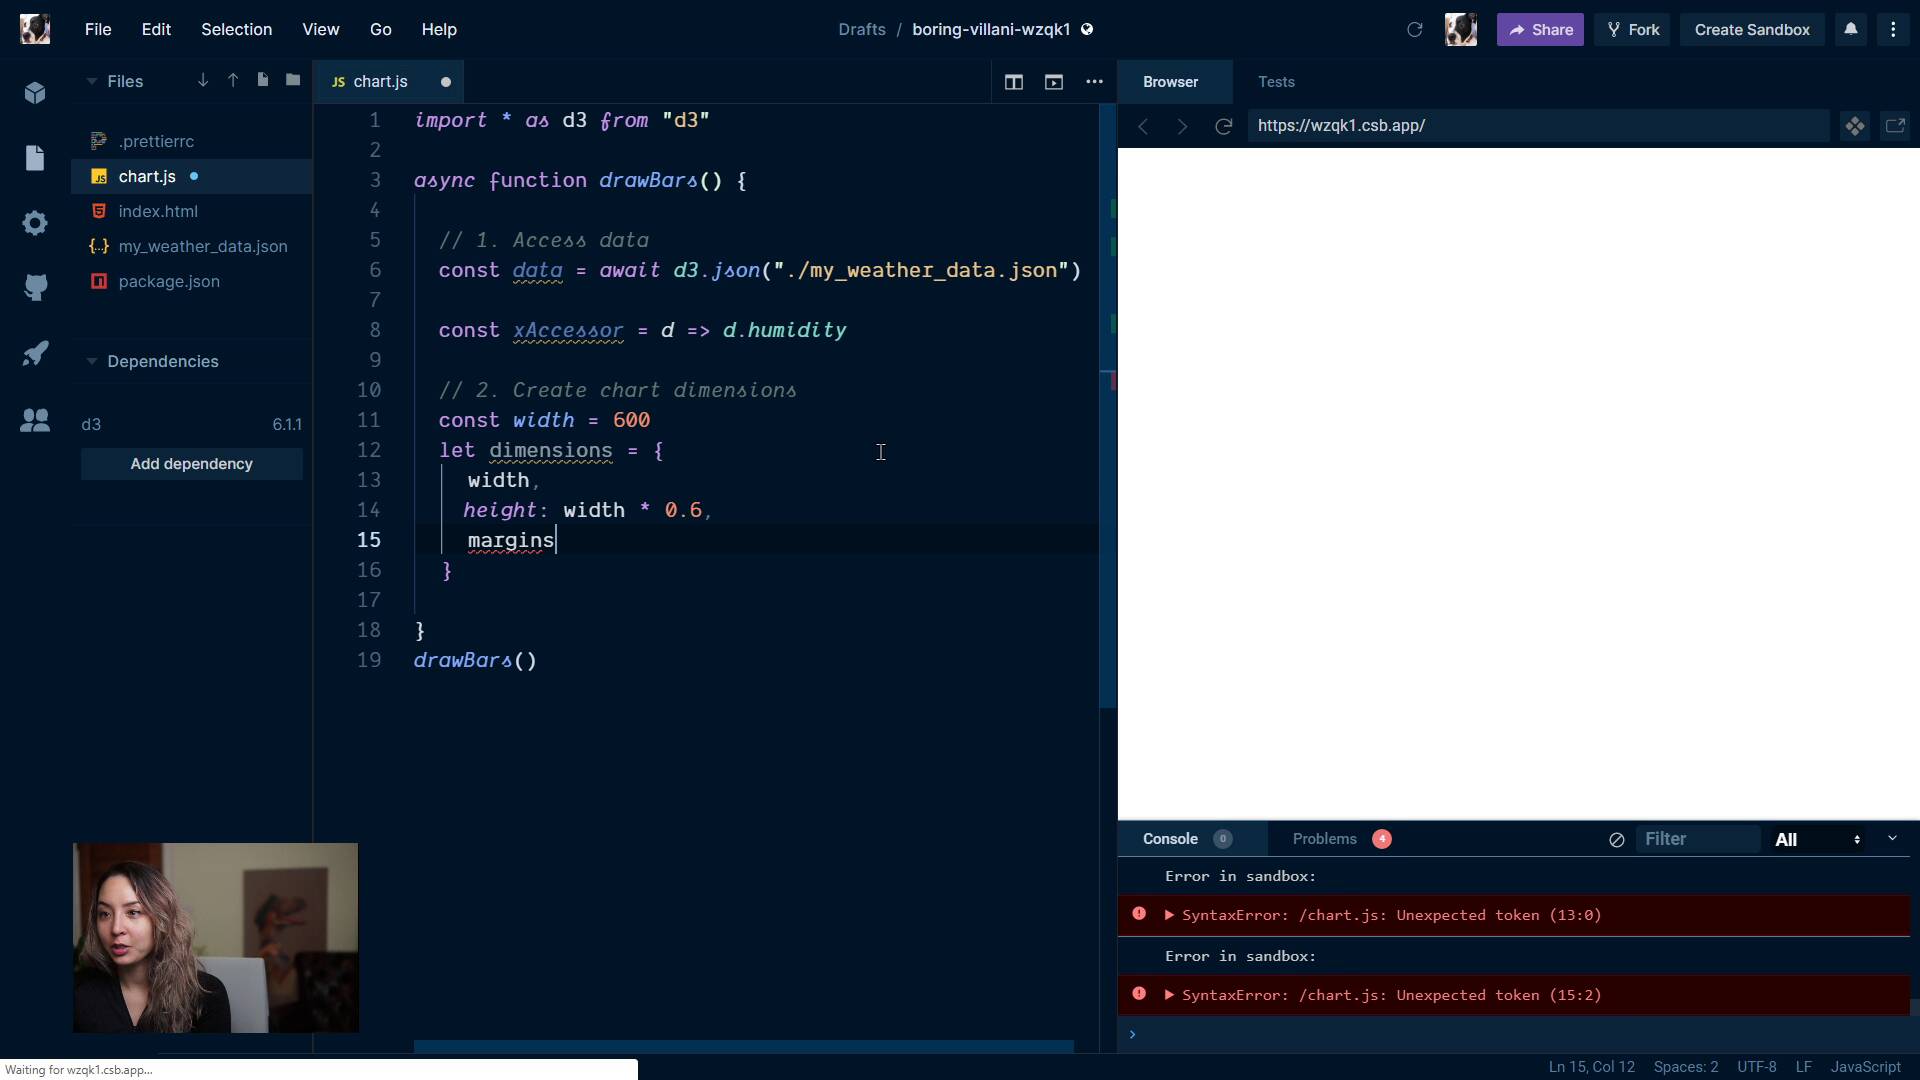
Create dimensionsFullstack D3 MasterclassA hopefully familiar step by now: creating our chart dimensions.
lesson
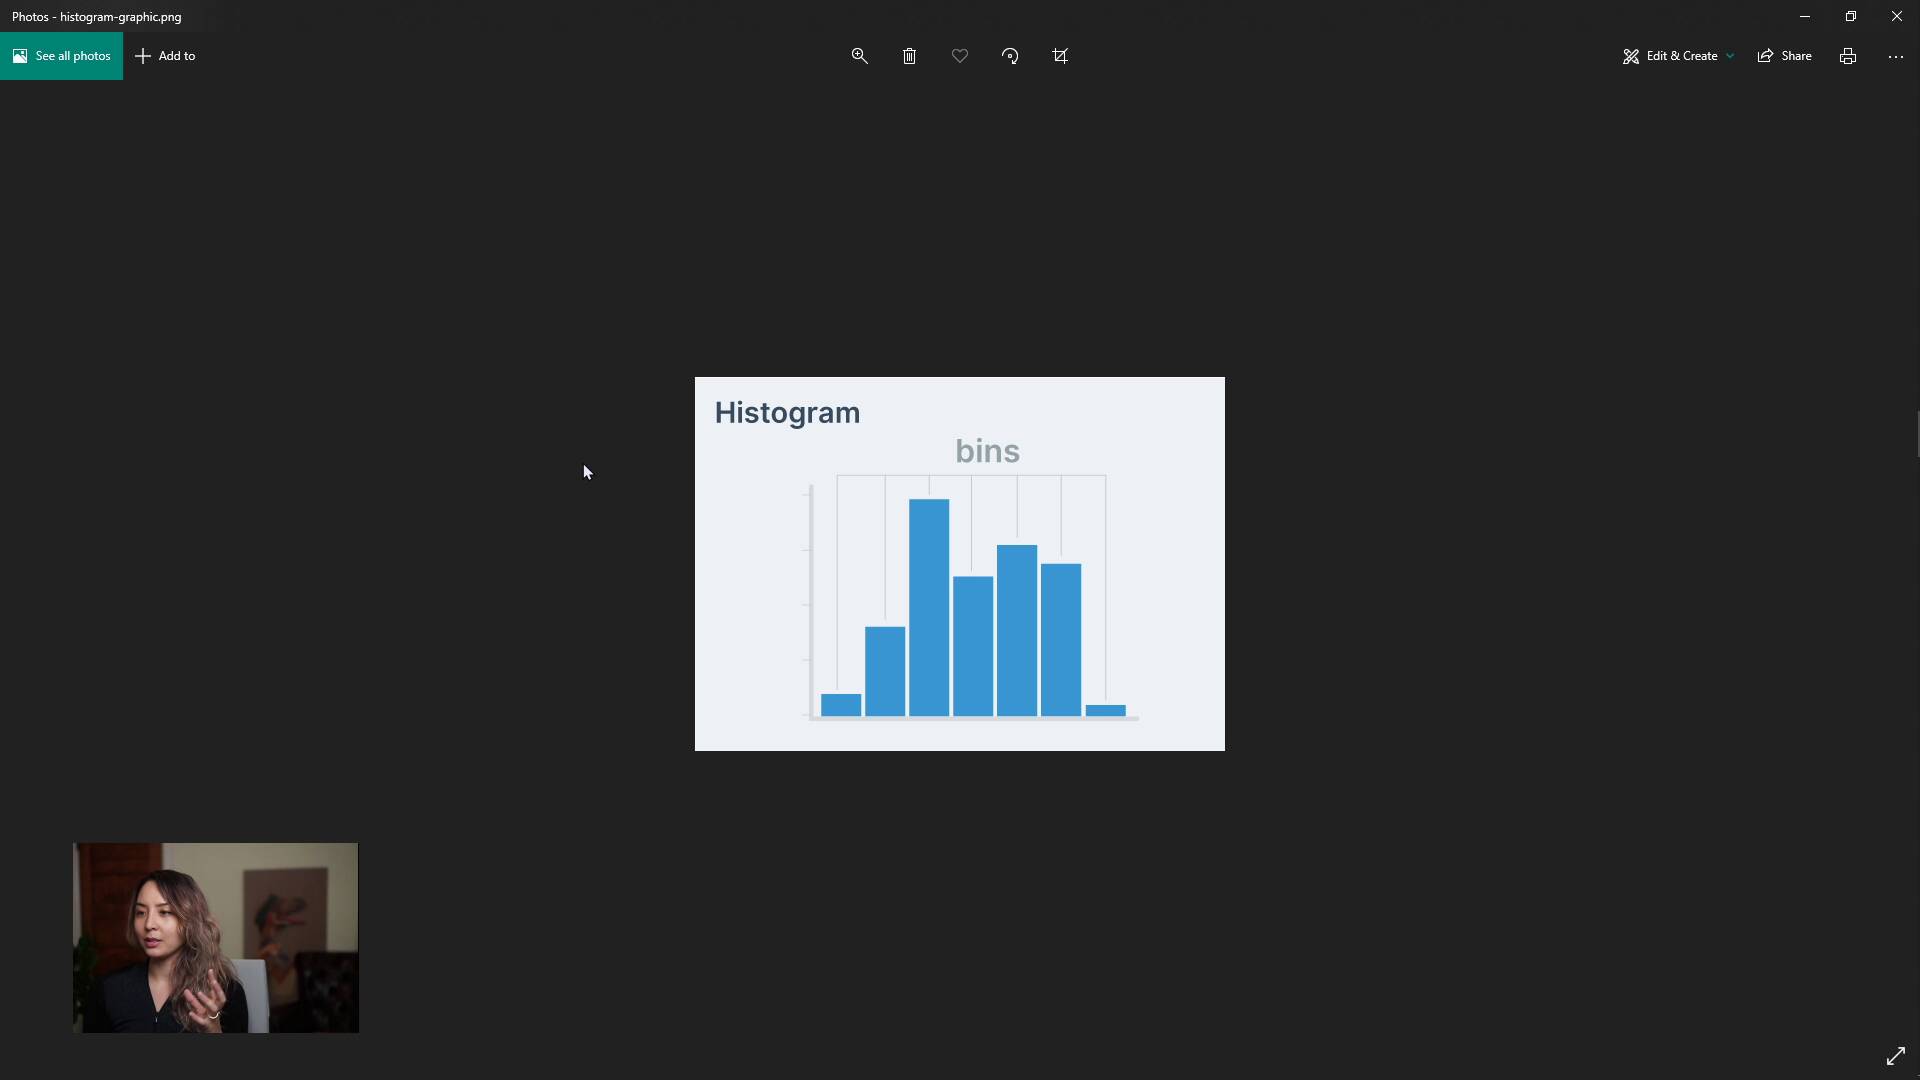
Making a Bar ChartFullstack D3 MasterclassNext, we embark on a mission to create a slightly more complex chart: a bar chart. We talk about what we can learn from a bar chart, and what a histogram is.

lesson
Extra credit: adding a color scaleFullstack D3 MasterclassWe learn how to create a custom color scale, then we color our circles based on another metric: cloud cover.