


Lessons
view all ⭢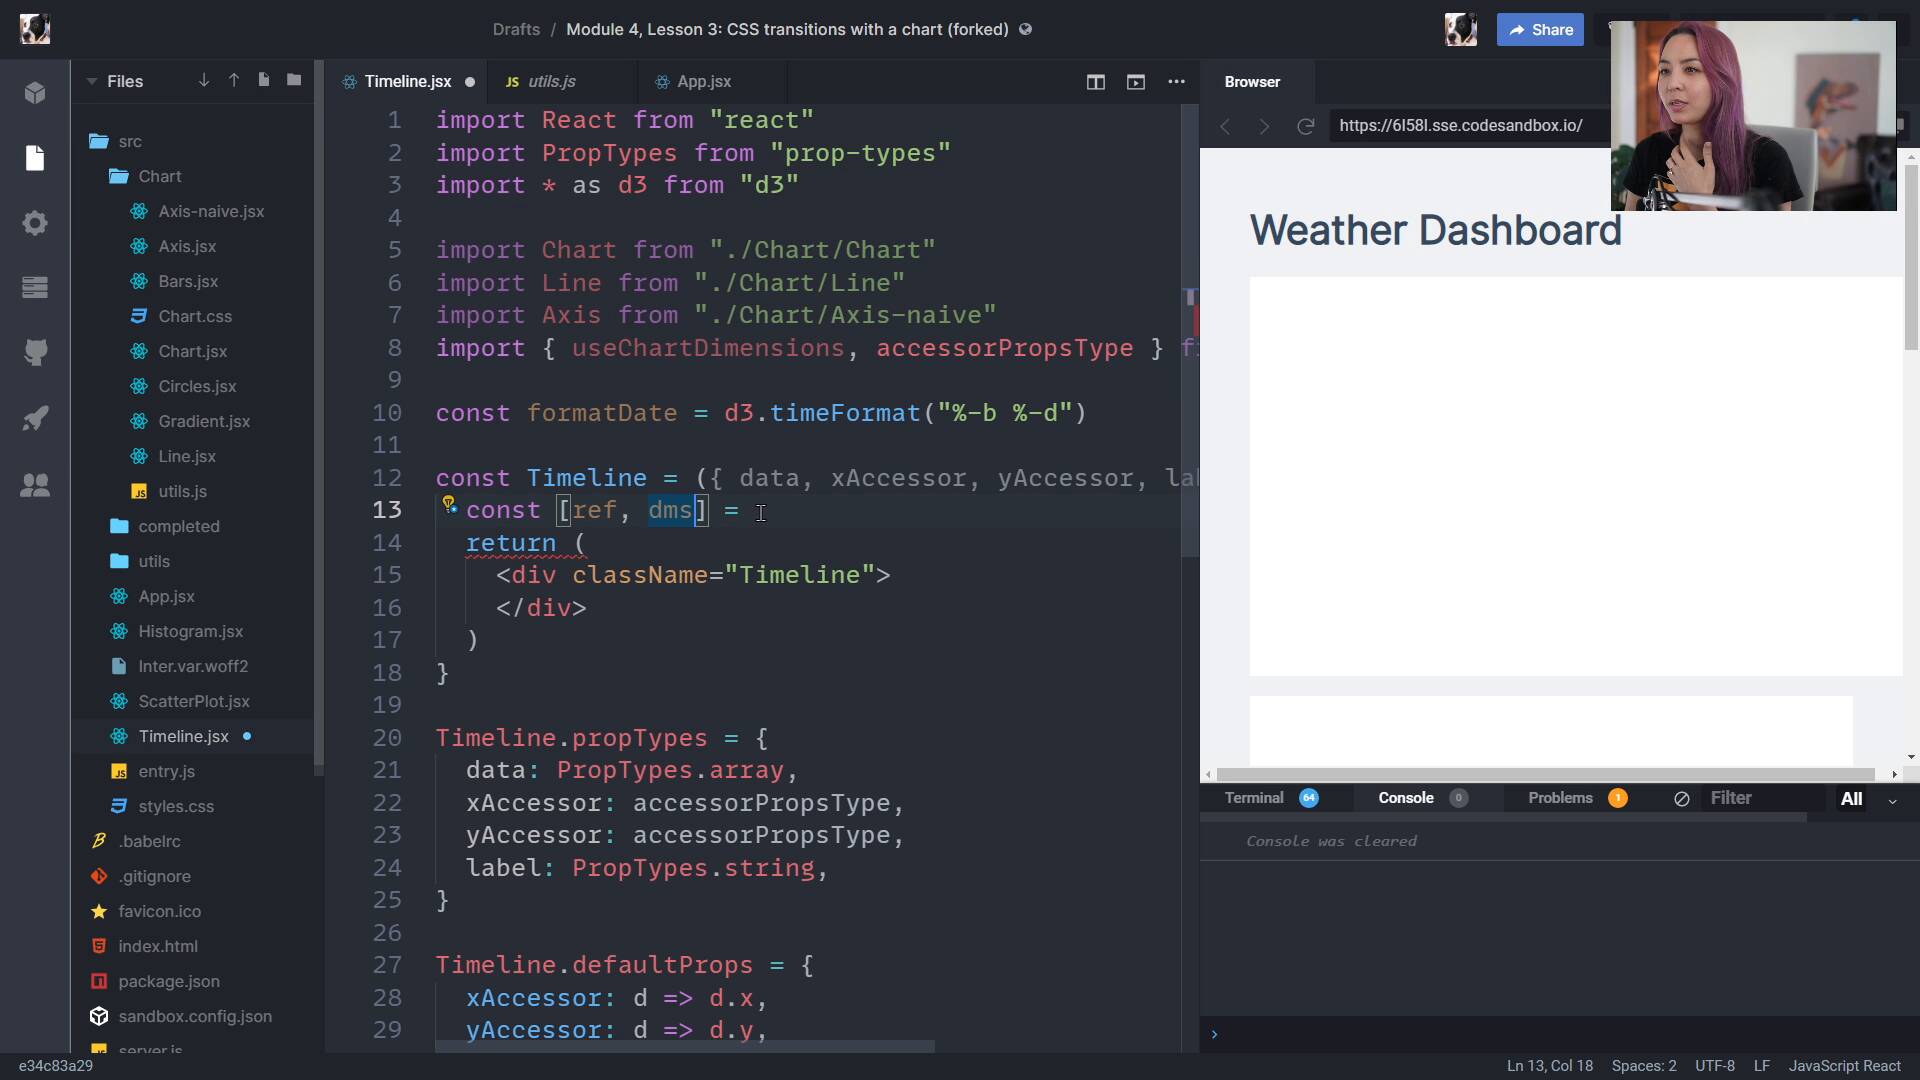
lesson
Creating dimensions in ReactFullstack D3 MasterclassCreating dimensions in React can be really easy! We use a custom hook for watching the size of our wrapper and automatically calculating the dimensions of our bounds.

lesson
Week 7: ExerciseFullstack D3 MasterclassLet's consolidate what we just learned with an exercise to play with this week.
lesson
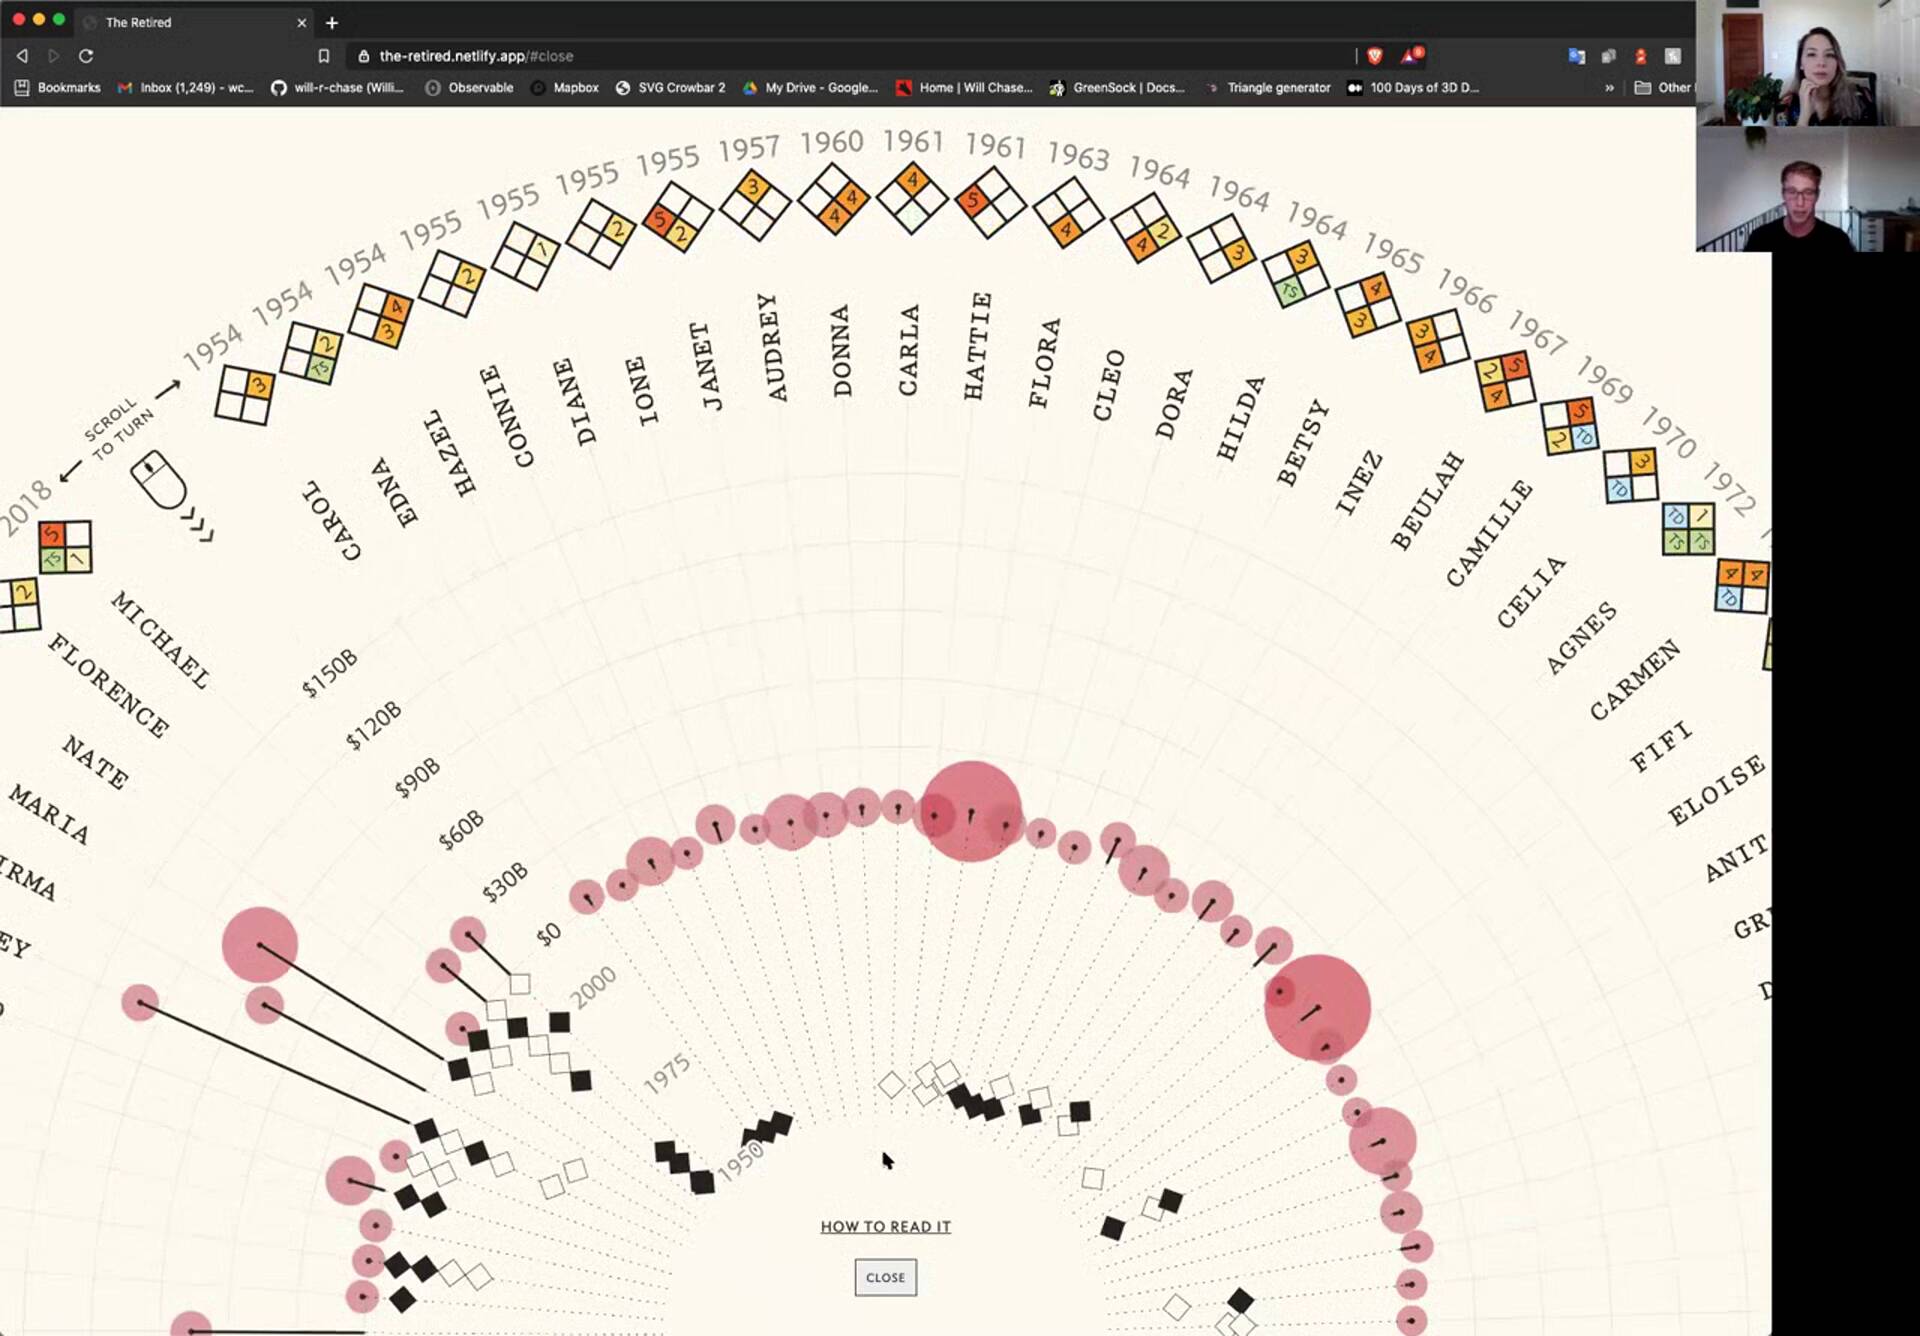
Will ChaseFullstack D3 MasterclassWill Chase talks us through how he got into data viz, the difference between work and freelance projects, and walks us through his most recent, wonderful visualization of hurricane names.

lesson
Russell GoldenbergFullstack D3 MasterclassRussell Goldenberg talks to us about what it's like working at the Pudding, his journey from Comp Sci to creative computation, and drops some great tips for working on data viz projects.
lesson
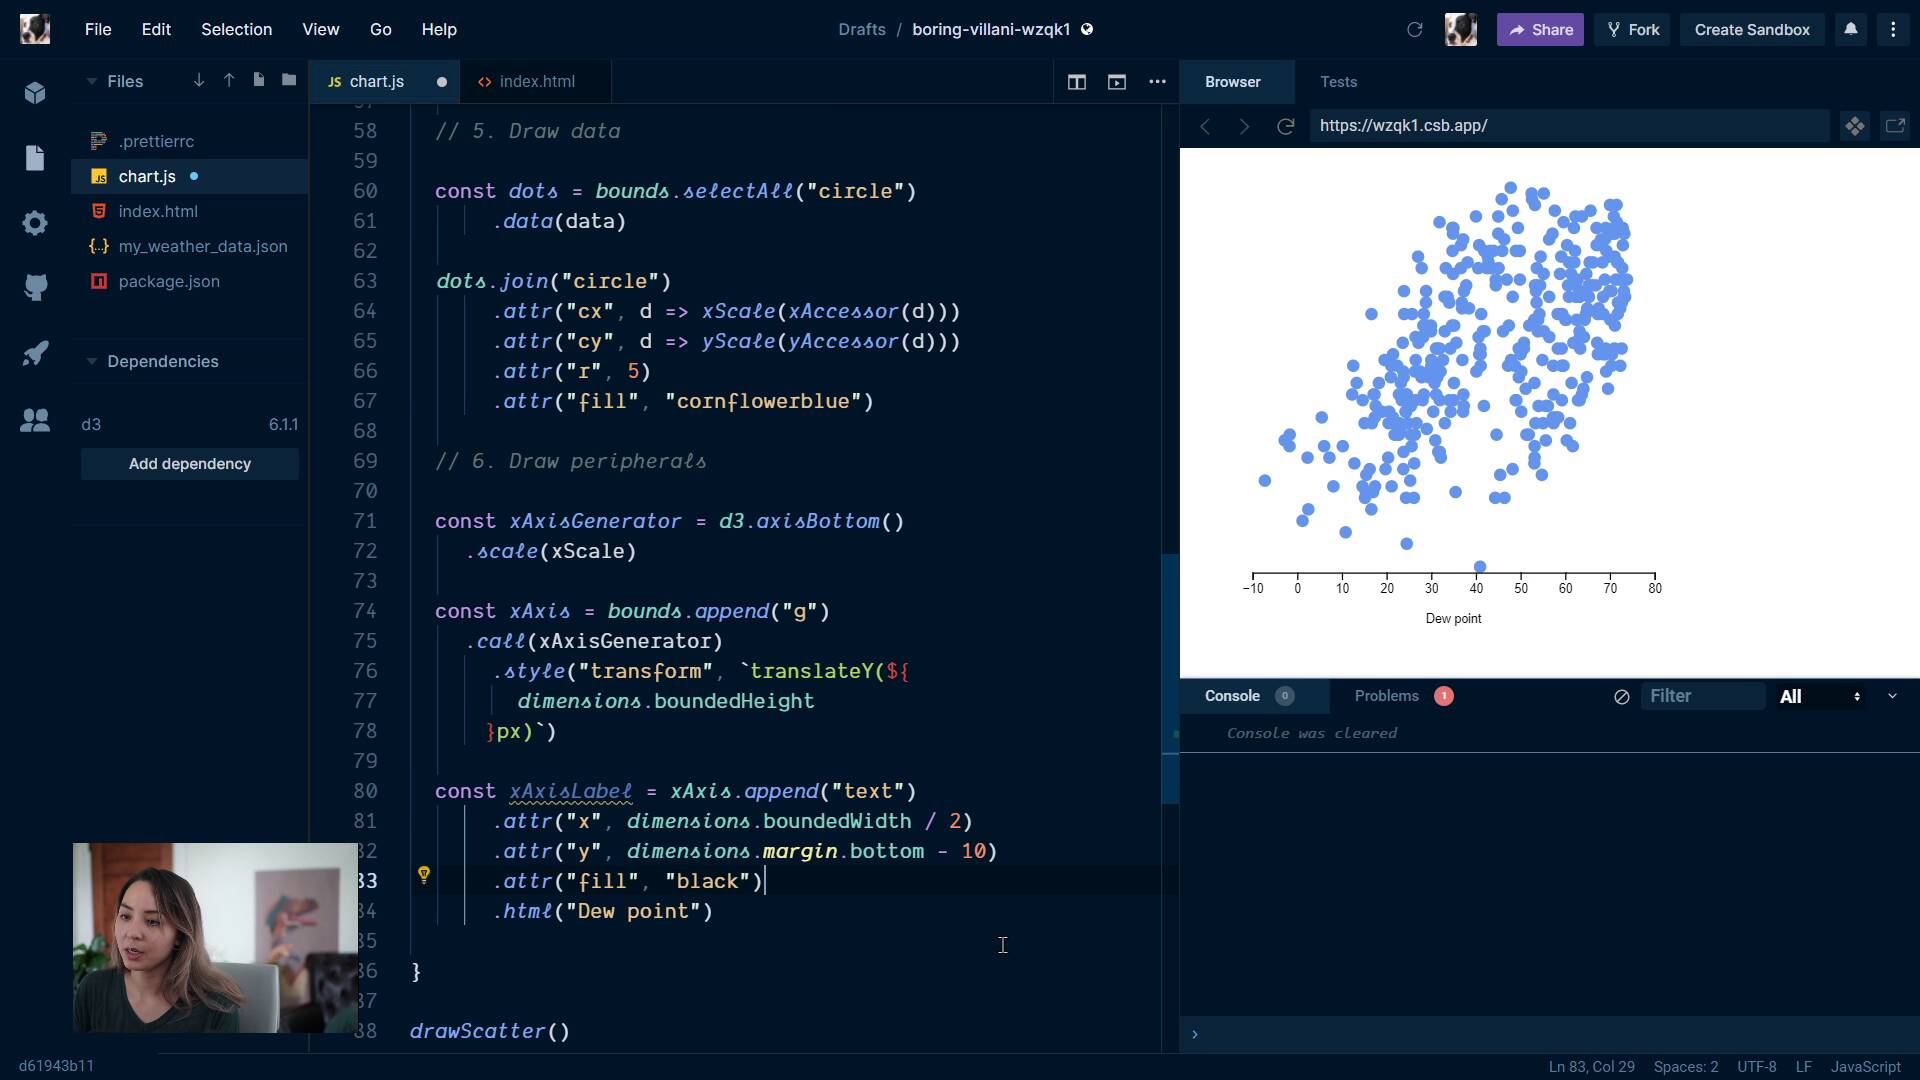
Step 6: Draw peripheralsFullstack D3 MasterclassOur sixth step: drawing peripherals. We draw our axes, learn about the text SVG element, and how to add (and rotate) labels.
lesson
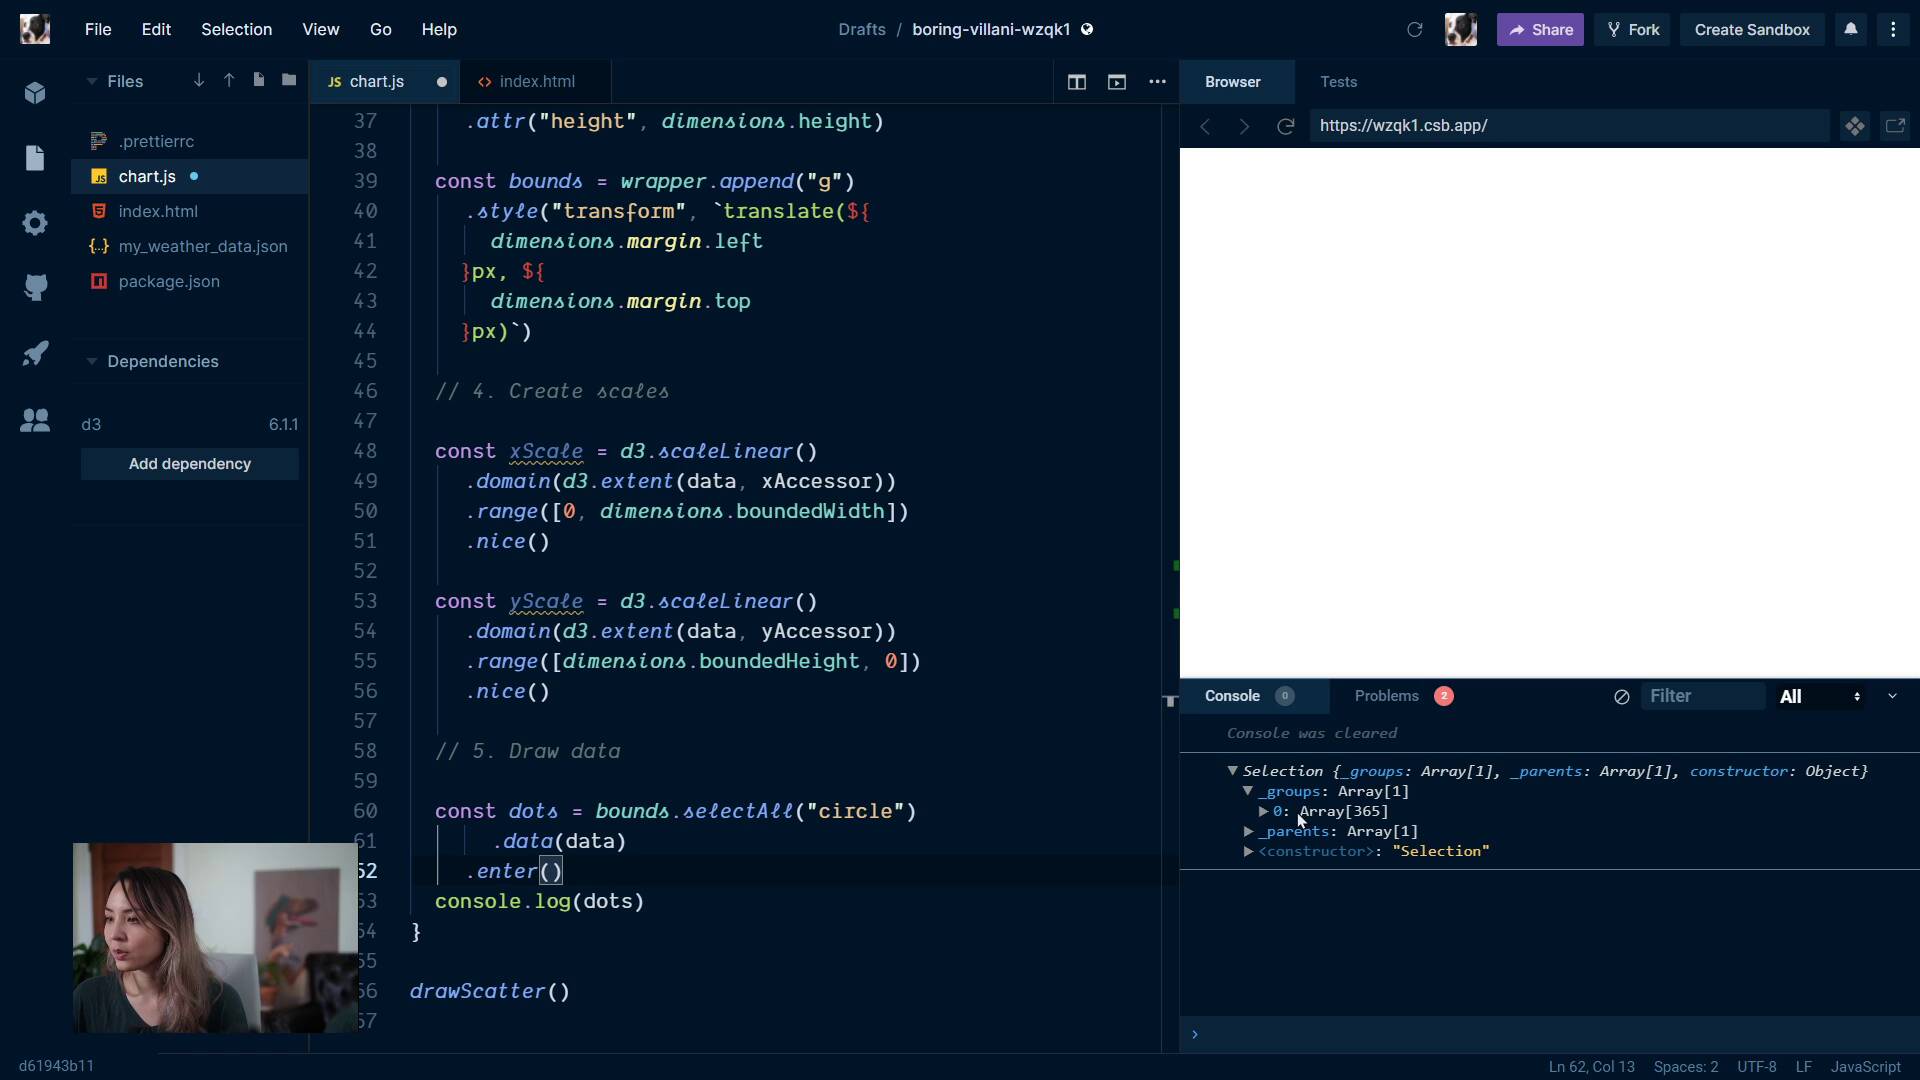
Step 5: Draw dataFullstack D3 MasterclassThe fifth step: drawing our data. This is an important lesson! We talk about data joins, which are one of the trickiest parts of d3, and necessary for updating our charts & binding our visualization to data.

lesson
Step 4: Create scalesFullstack D3 MasterclassThe fourth step: creating our scales. We talk about scales in more depth, and learn about d3.extent() & .nice().

lesson
Step 3: Draw canvasFullstack D3 MasterclassThe third step: drawing our canvas. We create our wrapper & bounds, then shift them to respect our margins.

lesson
Step 2: Create chart dimensionsFullstack D3 MasterclassThe second step: creating chart dimensions. This time, we learn how to create a square chart that fits within any browser window.

lesson
Step 1: Access dataFullstack D3 MasterclassWe talk through our first step: accessing our data.
lesson
Week 6: ExerciseFullstack D3 MasterclassLet's consolidate what we just learned with an exercise to play with this week.
lesson
Week 5: ExerciseFullstack D3 MasterclassLet's consolidate what we just learned with an exercise to play with this week.