Tags
    Author
      Technology
        Rating
        Pricing
        Sort By
        Video
        Results To Show
        Most Recent
        Most Popular
        Highest Rated
        Reset
        https://image.mux.com/9FnlfY00LtcZdSa9uGZreRsUt4kDAxXJKtlAXpwLgJ8Q/thumbnail.png?time=0

        lesson

        Drawing the lineFullstack D3 Masterclass

        We learn about path SVG elements and how to construct a string for their d attribute.

        https://image.mux.com/EVaZGNsK4DnECdPG9lGRbtlLIwmVq2V01O6lupKuFE7g/thumbnail.png?time=0

        lesson

        Creating our scalesFullstack D3 Masterclass

        We learn about scales and create our first ones: our y and x scales.

        https://image.mux.com/GoQL1qoUOlEkKVK4bbrUy009hYZpIcexCWgldmWMRg01k/thumbnail.png?time=0

        lesson

        Creating our bounding boxFullstack D3 Masterclass

        We create our bounding box, and shift it to respect our margins.

        https://image.mux.com/laD5wHCWJr68bAFQ3DgswMazrAYVf011aTYf1Q02l2eng/thumbnail.png?time=0

        lesson

        Adding an SVG elementFullstack D3 Masterclass

        We learn how to create new elements inside of a d3 selection object.

        https://image.mux.com/y6y4eYJ400jDkB2kV7uQD7KaUW5PpbFrpSMx00OlZkFrE/thumbnail.png?time=0

        lesson

        Creating our workspaceFullstack D3 Masterclass

        We create our wrapper and learn about d3 selection objects.

        https://image.mux.com/awm00q3QZ01fgUFv2wlLE7012qqUHuEetoYBC4Wvk4Ikbs/thumbnail.png?time=0

        lesson

        Drawing our chartFullstack D3 Masterclass

        To set up our chart environment, we learn why we need two containers: wrapper and bounds.

        https://image.mux.com/LDjwqe5zvRHYxaGv01kXsCDzrdxsNumi02347cMnjpIV8/thumbnail.png?time=0

        lesson

        Setting up our line chartFullstack D3 Masterclass

        We learn how to set up our chart - accessor functions are crucial for easy changes, documentation, and framing.

        https://image.mux.com/MuxAccRdFr7hAEEZd01jdL8Yu00b73NWCOQph5uYNCmGw/thumbnail.png?time=0

        lesson

        Loading the weather datasetFullstack D3 Masterclass

        First things first, we learn how to load our dataset and look at the structure.

        https://image.mux.com/K4ntxrkLu4kVeobHWANn7jY8QBIu1Fccx8LeVoSsVoc/thumbnail.png?time=0

        lesson

        Making Your First ChartFullstack D3 Masterclass

        We dig in right away, starting with a timeline of temperature over time. First, we need to get our bearings.

        https://embed-ssl.wistia.com/deliveries/c9ddb44cd9c655d473860cc7038c5d065fc52688.jpg

        lesson

        React.jsFullstack D3 Masterclass

        We are introduced to React.js and learn a basic principle for combining d3 + React.

        https://embed-ssl.wistia.com/deliveries/d084234e79ca0d38cc9ea494fbdddd4044233cdb.jpg

        lesson

        Adding the tooltipFullstack D3 Masterclass

        Onto our last step: adding interactions! The tooltip we'll build will be unlike any you've seen before - it will follow the mouse all the way around our chart, highlight the relevant data elements, and describe the weather for that hovered date.

        https://embed-ssl.wistia.com/deliveries/9453dc0051a3517cf01cd7616c3d1ae38812da98.jpg

        lesson

        Adding annotationsFullstack D3 Masterclass

        We'll add annotations to our chart to tell our viewer what the different parts of the chart are showing. To do this, we'll create a generic function, since there are so many things to label.


        Articles

        view all ⭢
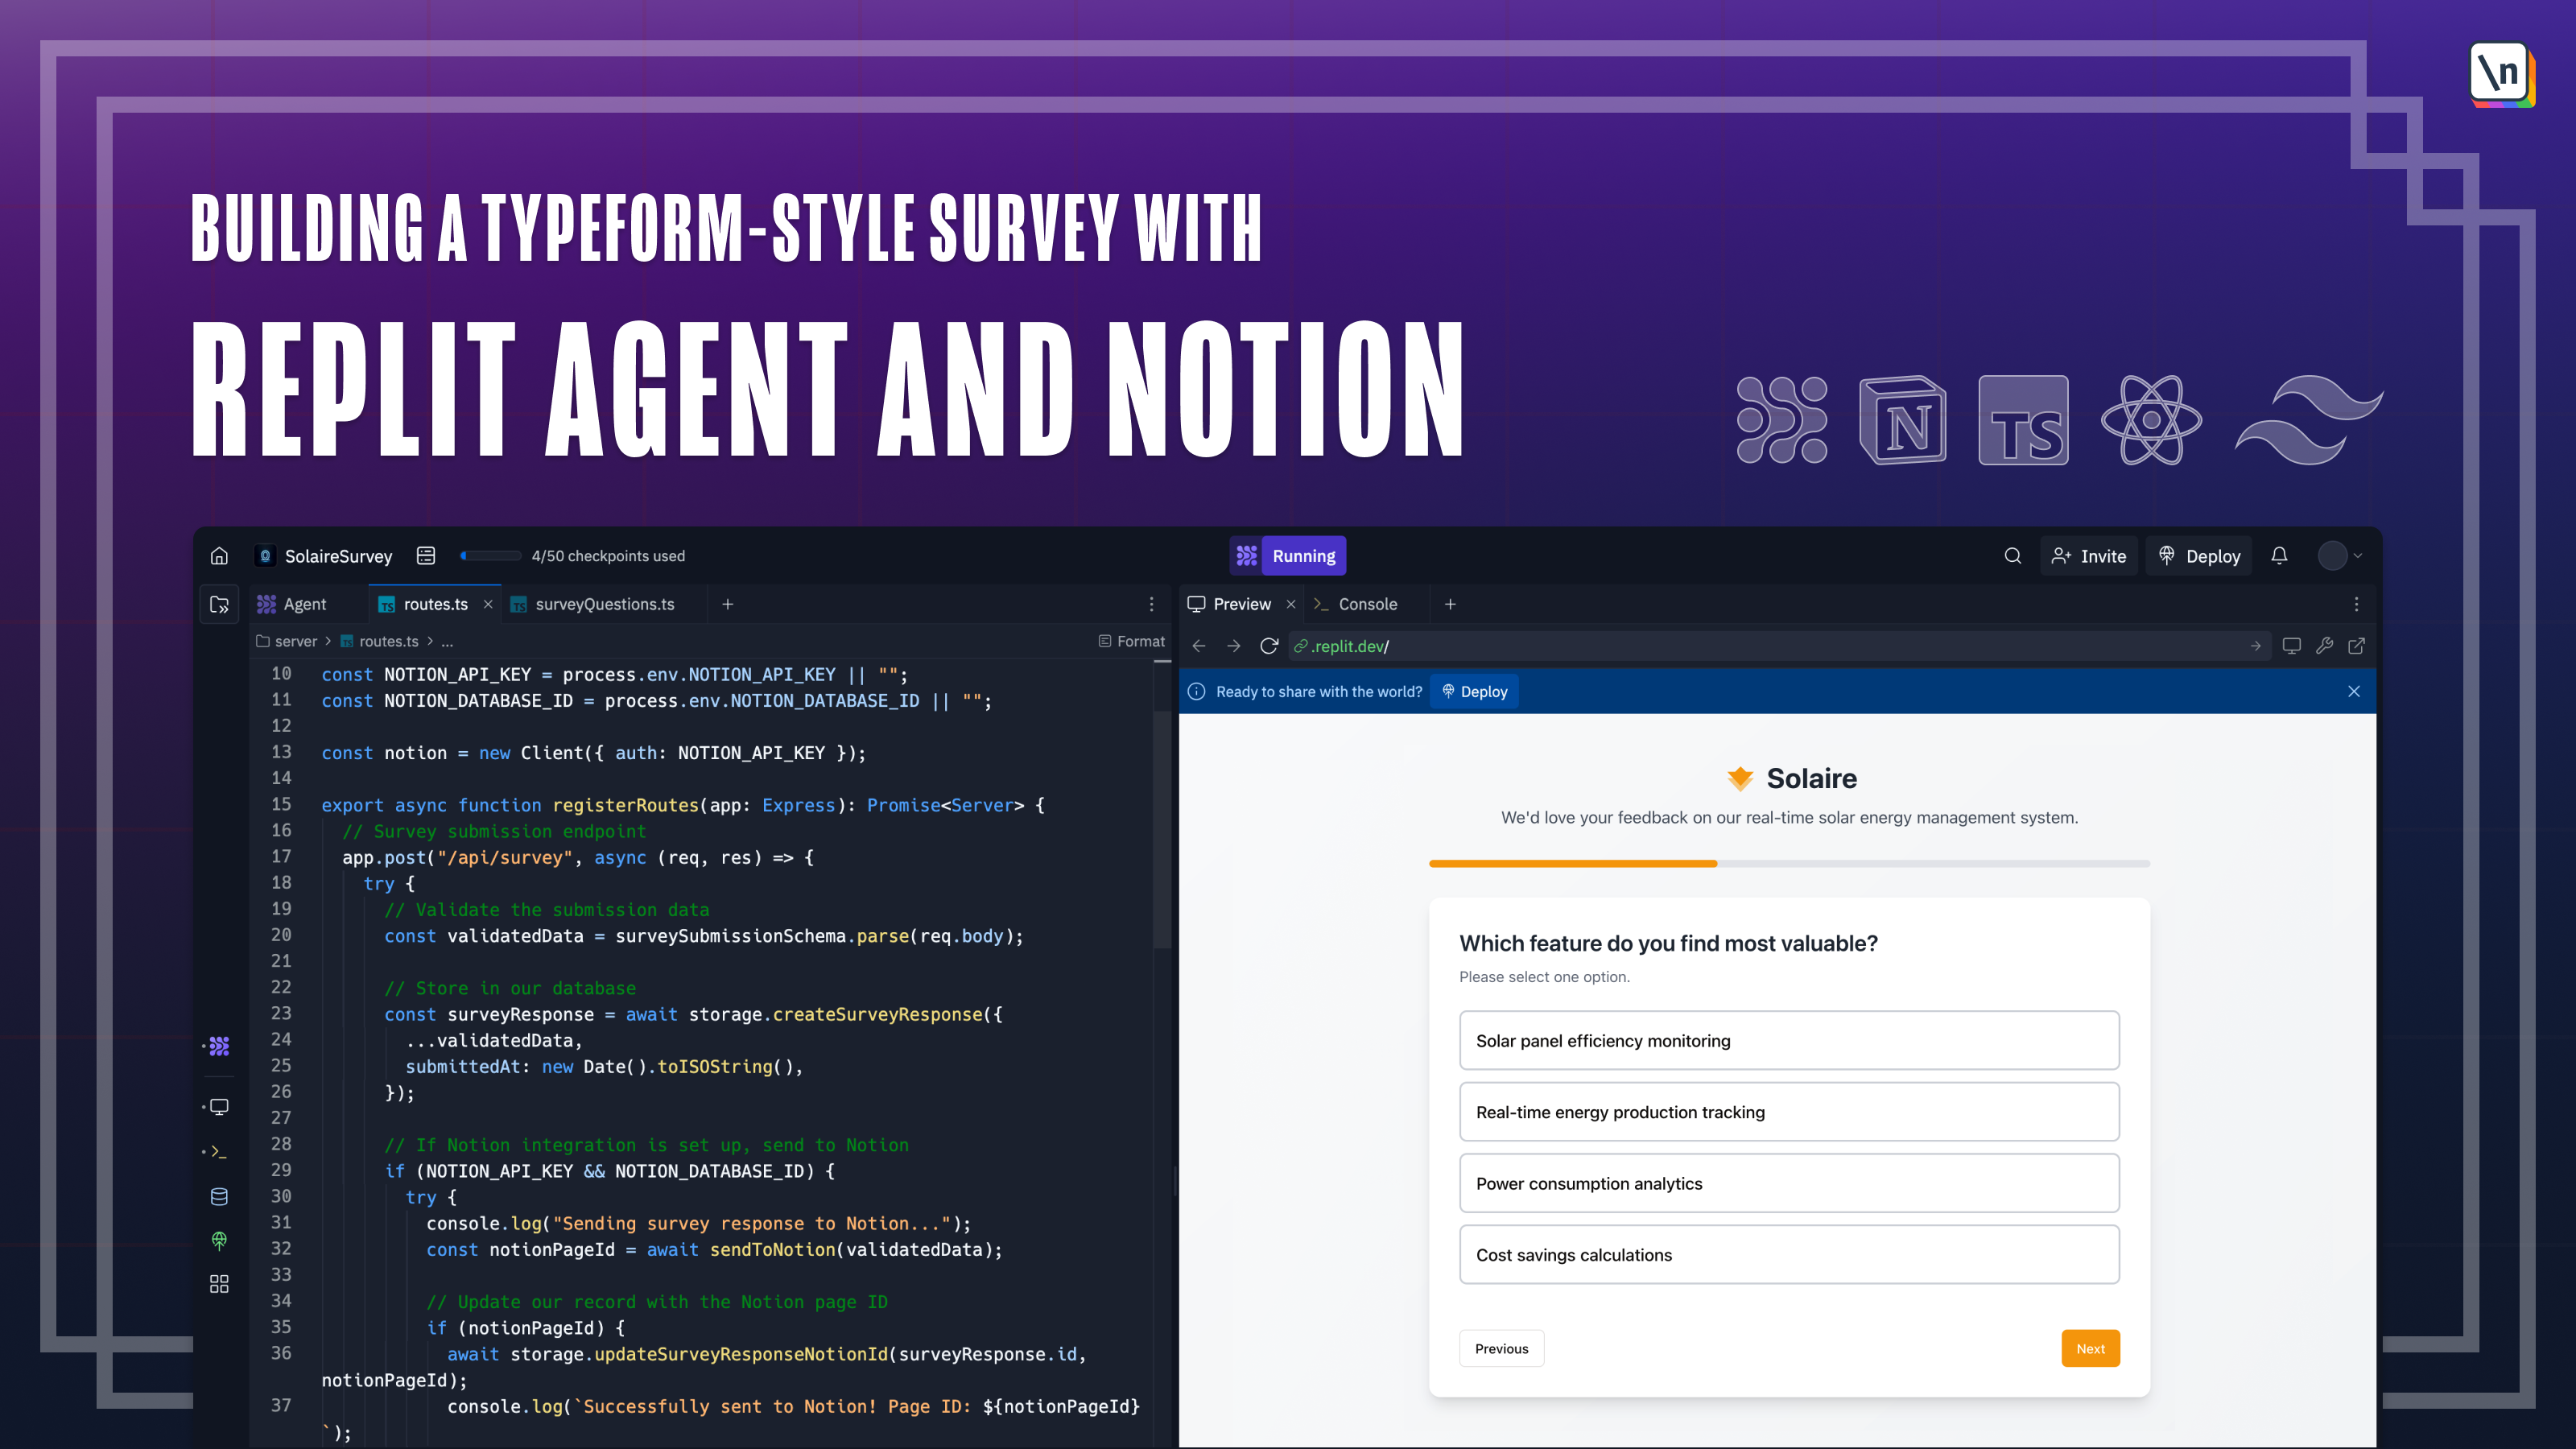
        Creating a Typeform-Style Survey with Notion and Replit Agent

        Learn how to create a custom Typeform-style survey with Replit Agent, an adva...

        Creating a Slack Bot with Replit Assistant and Bolt (Part I)

        Learn how to prompt Replit Assistant, an advanced AI-coding assistant, to cre...

        Creating a Discord Bot with Replit Agent and discord.js

        Learn how to create your first Discord bot with Replit Agent, an advanced AI-...