Most Recent
Most Popular
Highest Rated
Reset
Lessons
view all ⭢lesson
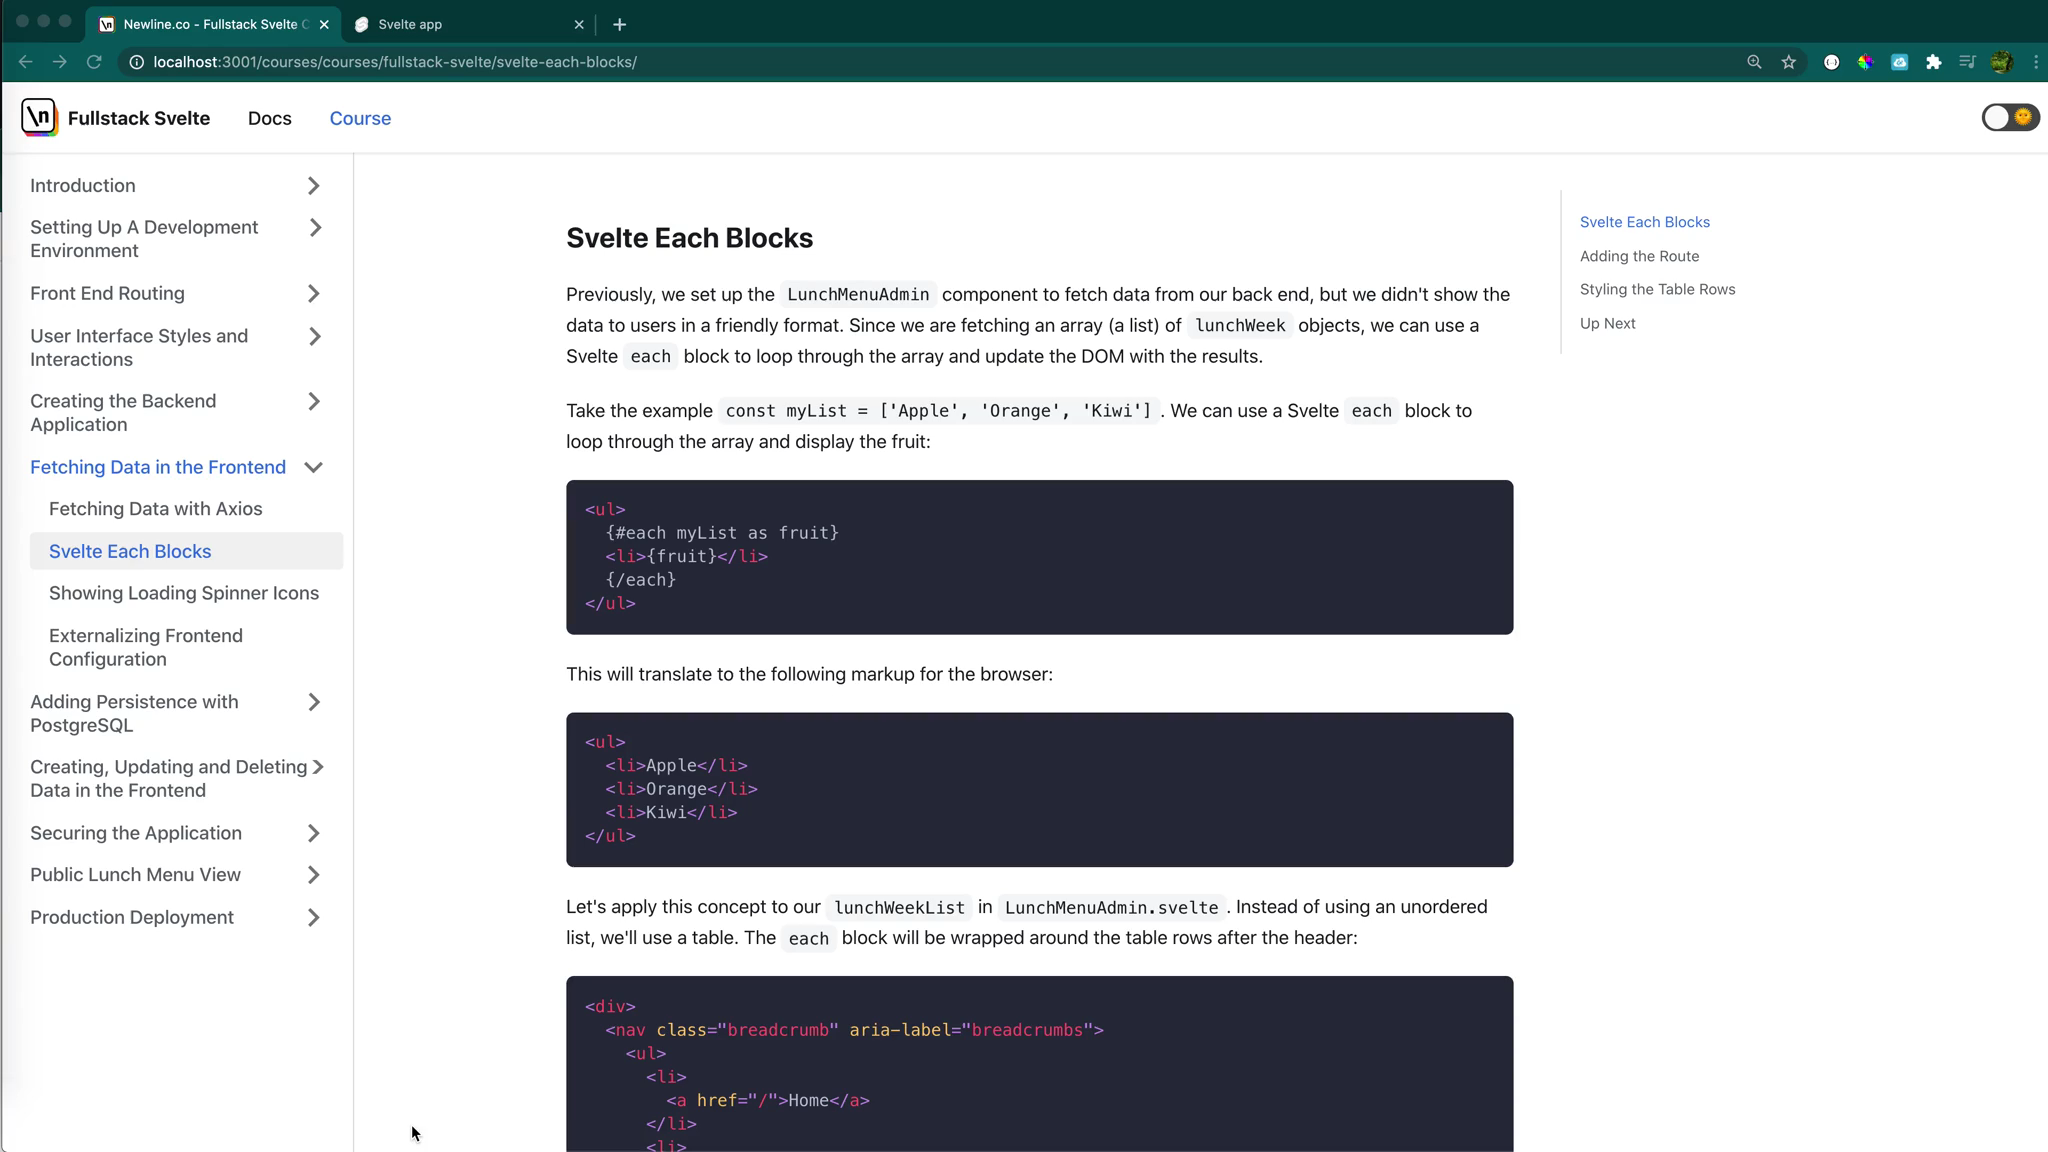
Svelte 'each' Blocks - Loop Through an Array and Update a DOMFullstack SvelteUsing Svelte Each Blocks to Iterate a List
lesson
How to Use Axios to Fetch Data From APIs for Svelte AppsFullstack SvelteFetching Data from the Frontend with Axios
lesson
Initialize an Express Node.js Project for Svelte DevelopmentFullstack SvelteInitializing an Express Node.js Project
lesson
A Guide to Handling DOM Events and Input Binding with SvelteFullstack SvelteUsing Svelte to handle DOM events and bind inputs
lesson
Using Front End Component Libraries for Svelte DevelopmentFullstack SvelteAdopting a Frontend Component Library
lesson
Front End Layouts - Creating Reusable Parent ComponentsFullstack SvelteCreating a Front End Layout for Admin Pages
lesson
An Introduction to Svelte Routing for Single Page ApplicationsFullstack SvelteSetting up a Single Page Application Router
lesson
Setting Up a Formatter and Linter for Svelte DevelopmentFullstack SvelteSetting up a Formatter and Linter
lesson
Setting Up a Svelte Local Development EnvironmentFullstack SvelteSetting up your local development environment


