Lessons
Explore all newline lessons
lesson
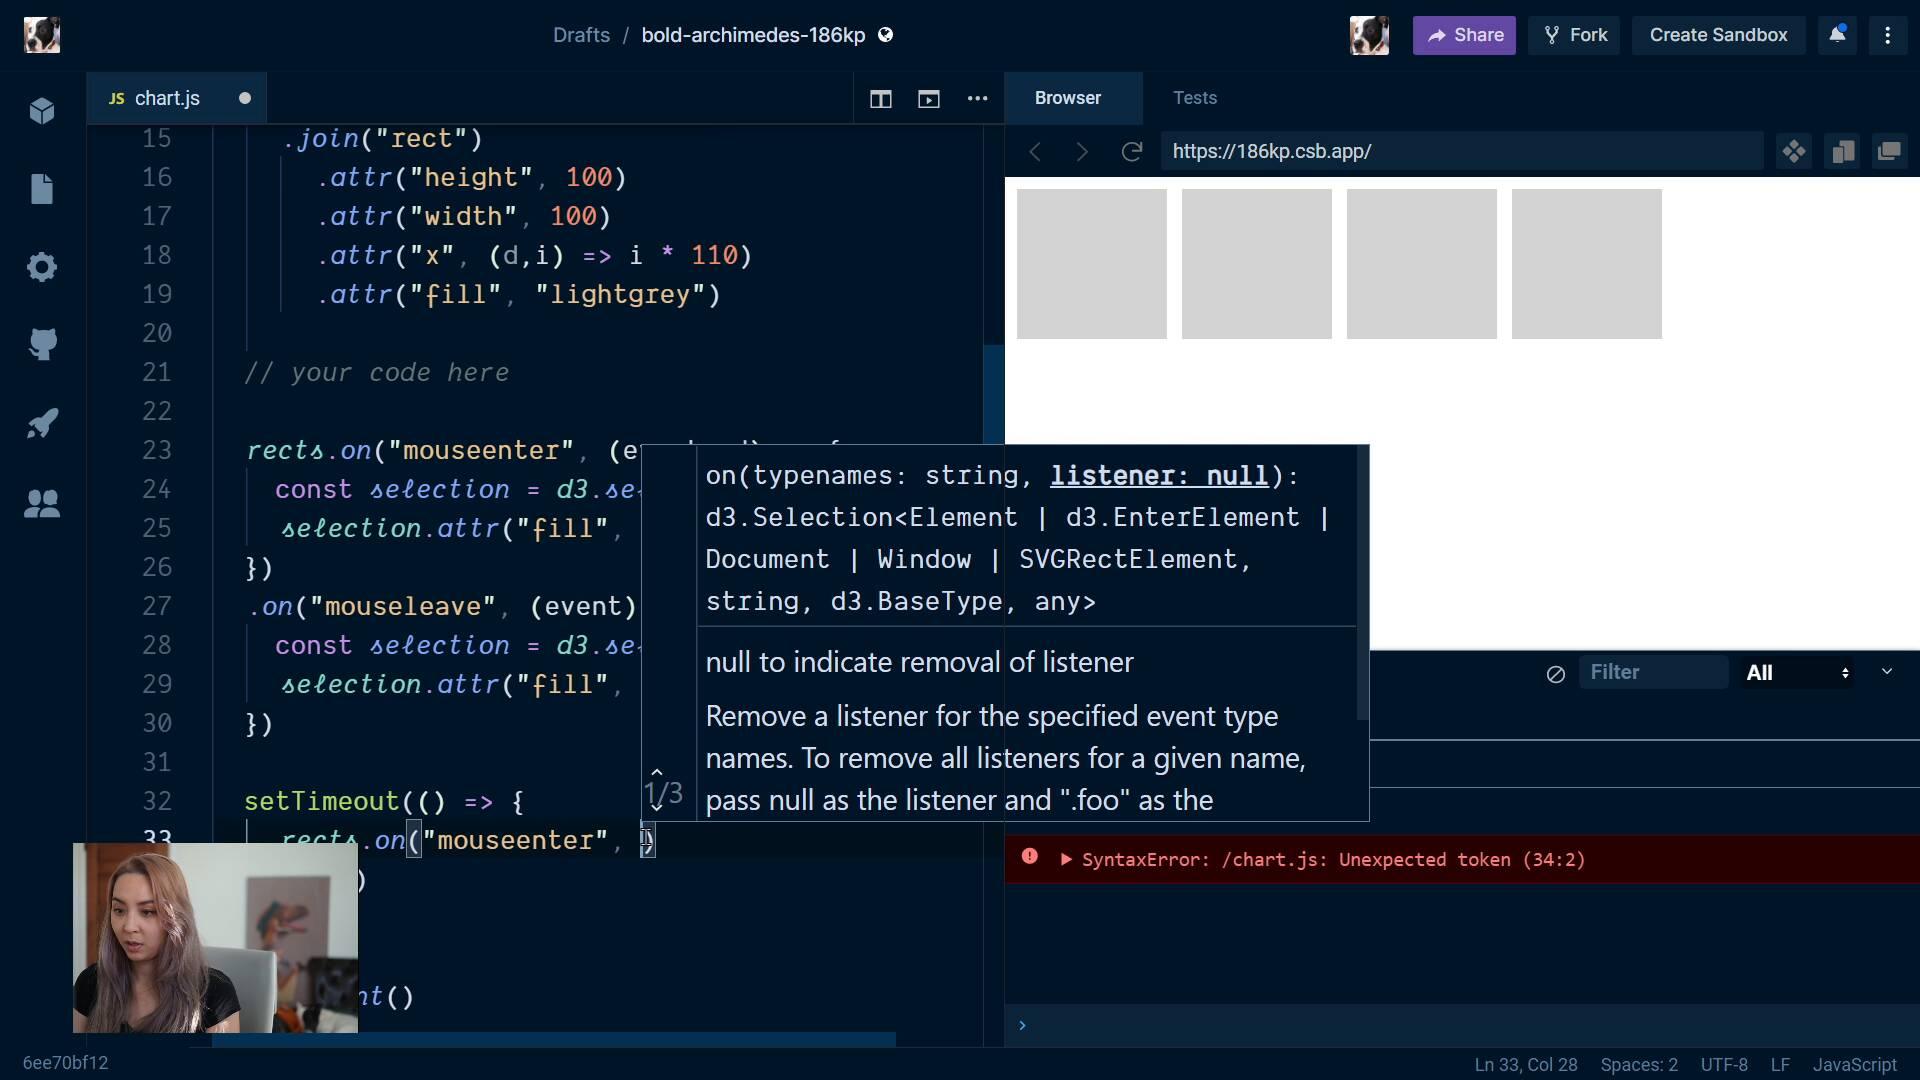
Destroying d3 event listenersFullstack D3 MasterclassWe can't let our event listeners hang around forever - we learn how to clean up after ourselves and cancel old ones.
lesson
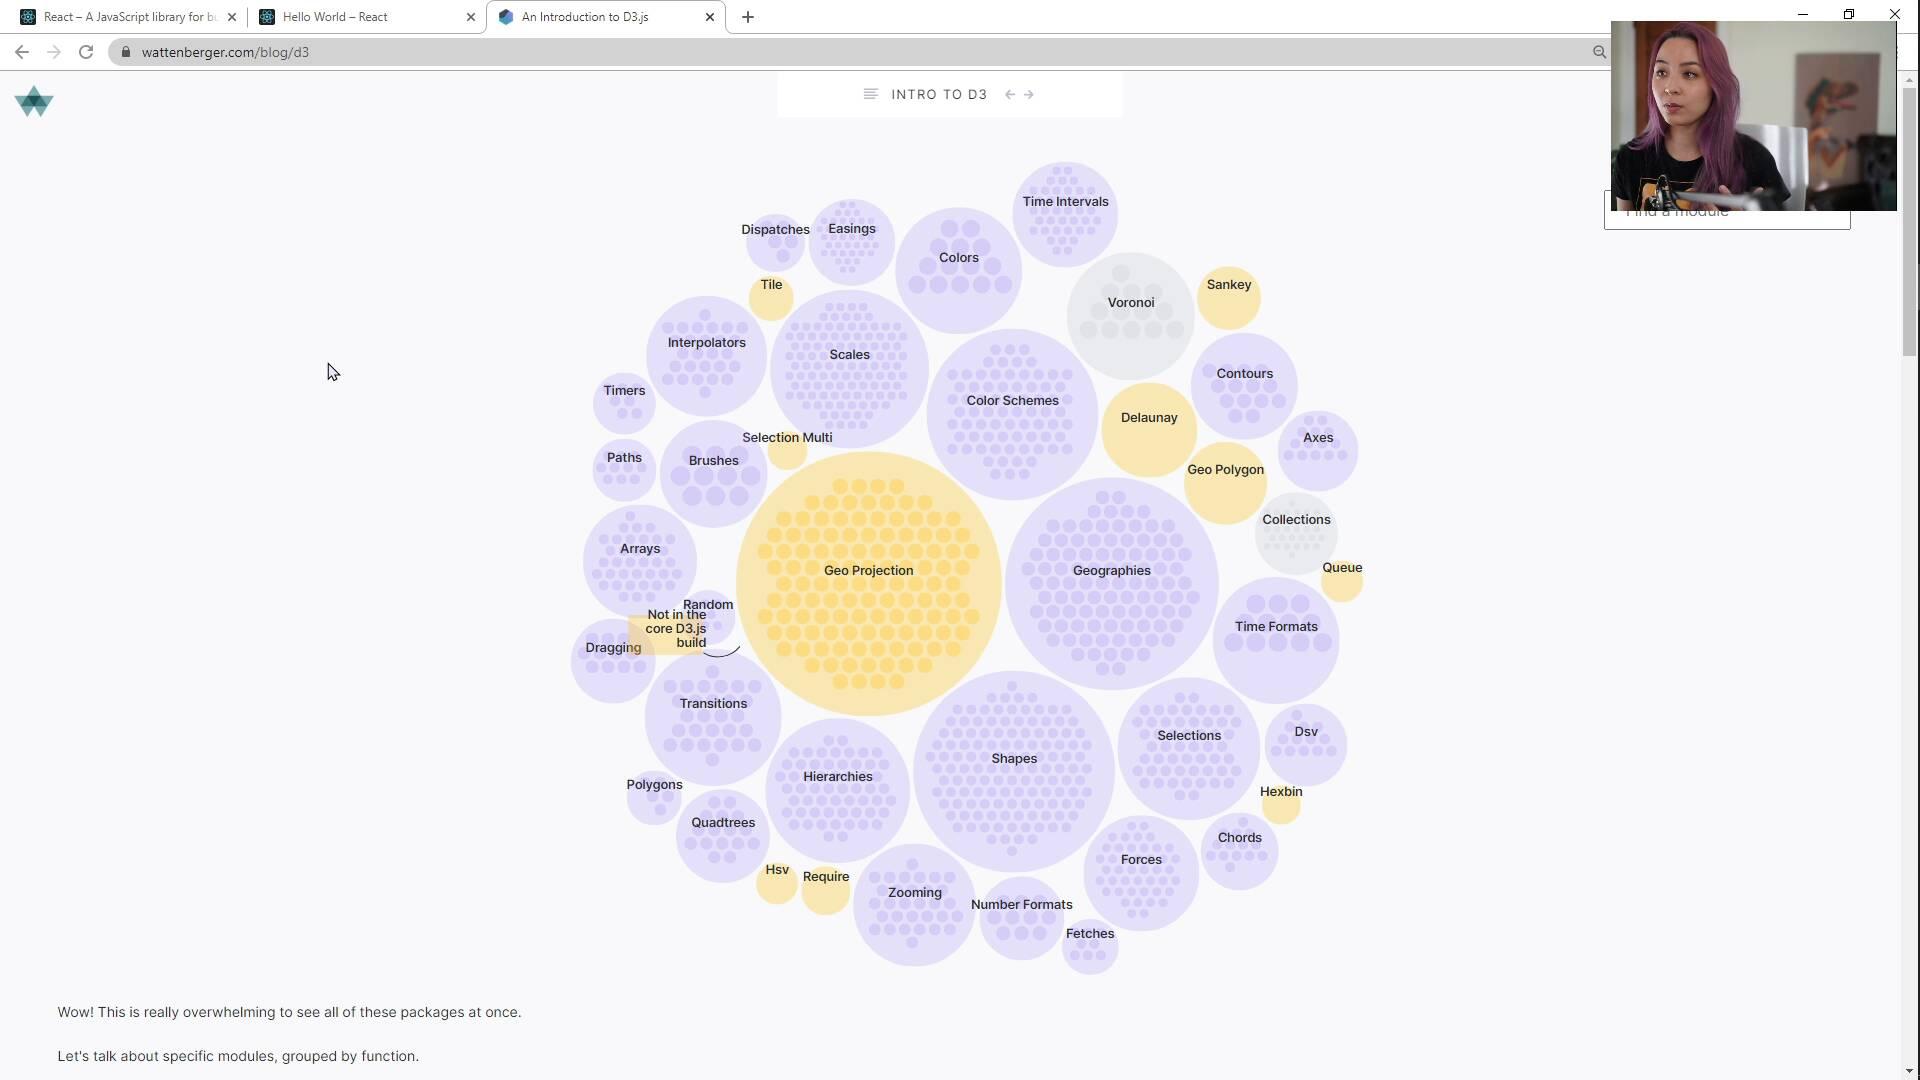
React.jsFullstack D3 MasterclassWe are introduced to React.js and learn a basic principle for combining d3 + React.
lesson
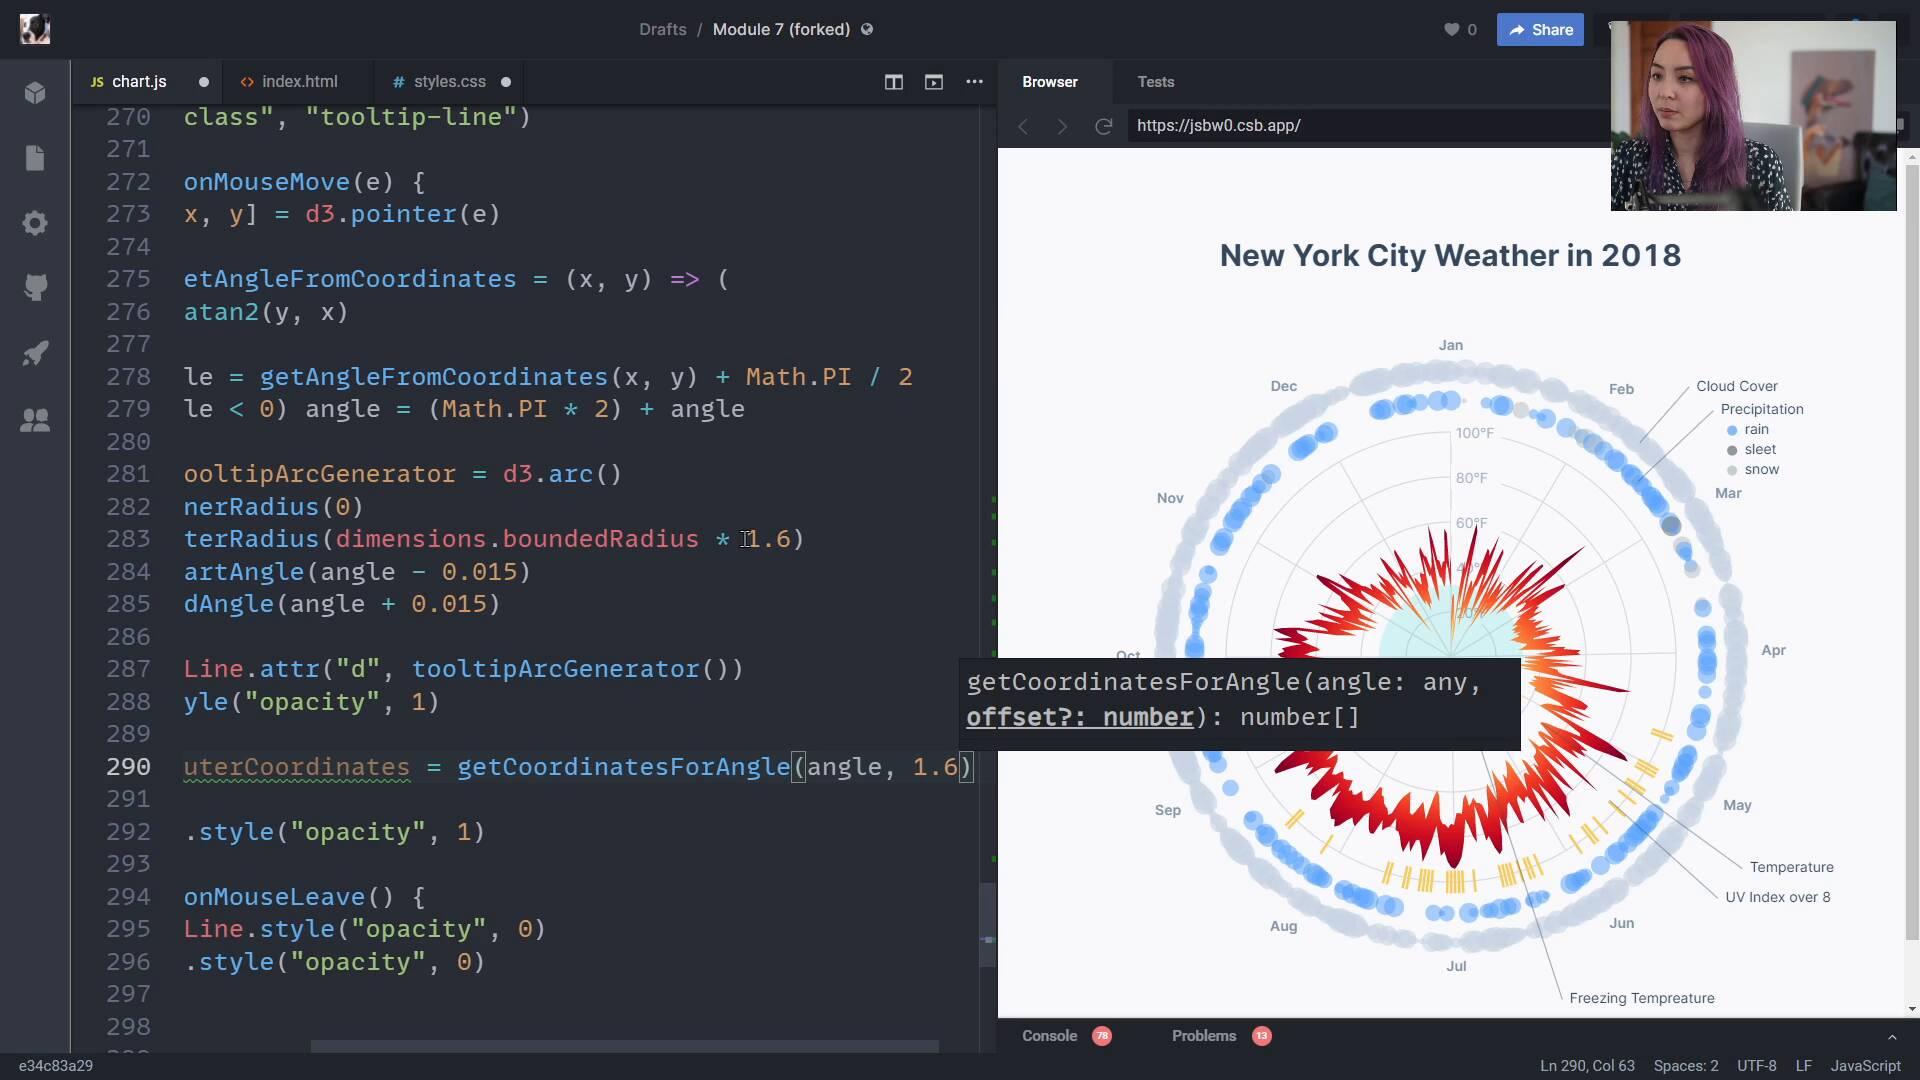
Adding the tooltipFullstack D3 MasterclassOnto our last step: adding interactions! The tooltip we'll build will be unlike any you've seen before - it will follow the mouse all the way around our chart, highlight the relevant data elements, and describe the weather for that hovered date.
lesson
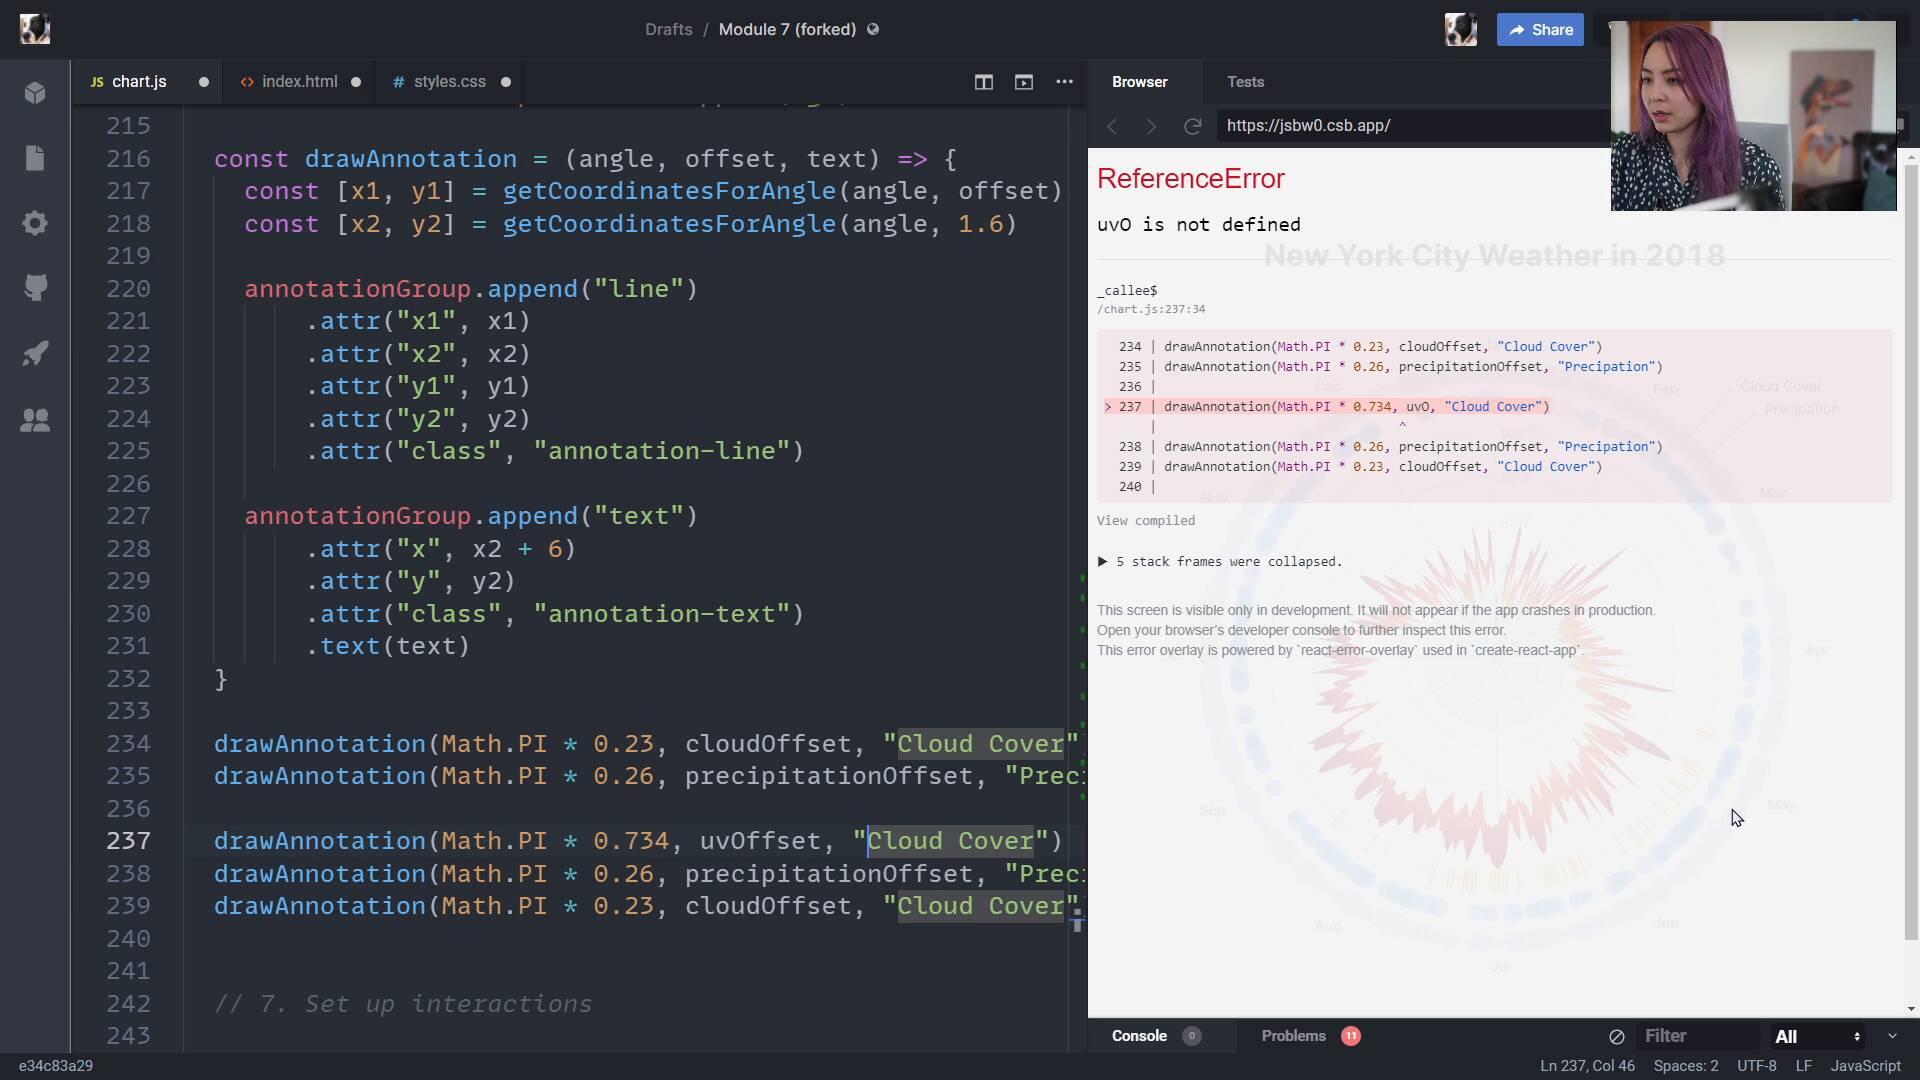
Adding annotationsFullstack D3 MasterclassWe'll add annotations to our chart to tell our viewer what the different parts of the chart are showing. To do this, we'll create a generic function, since there are so many things to label.

lesson
Adding the precipitation bubblesFullstack D3 MasterclassNext, we learn about ordinal scales and create the inner ring of circles to show the precipitation probability and type for each day.
lesson
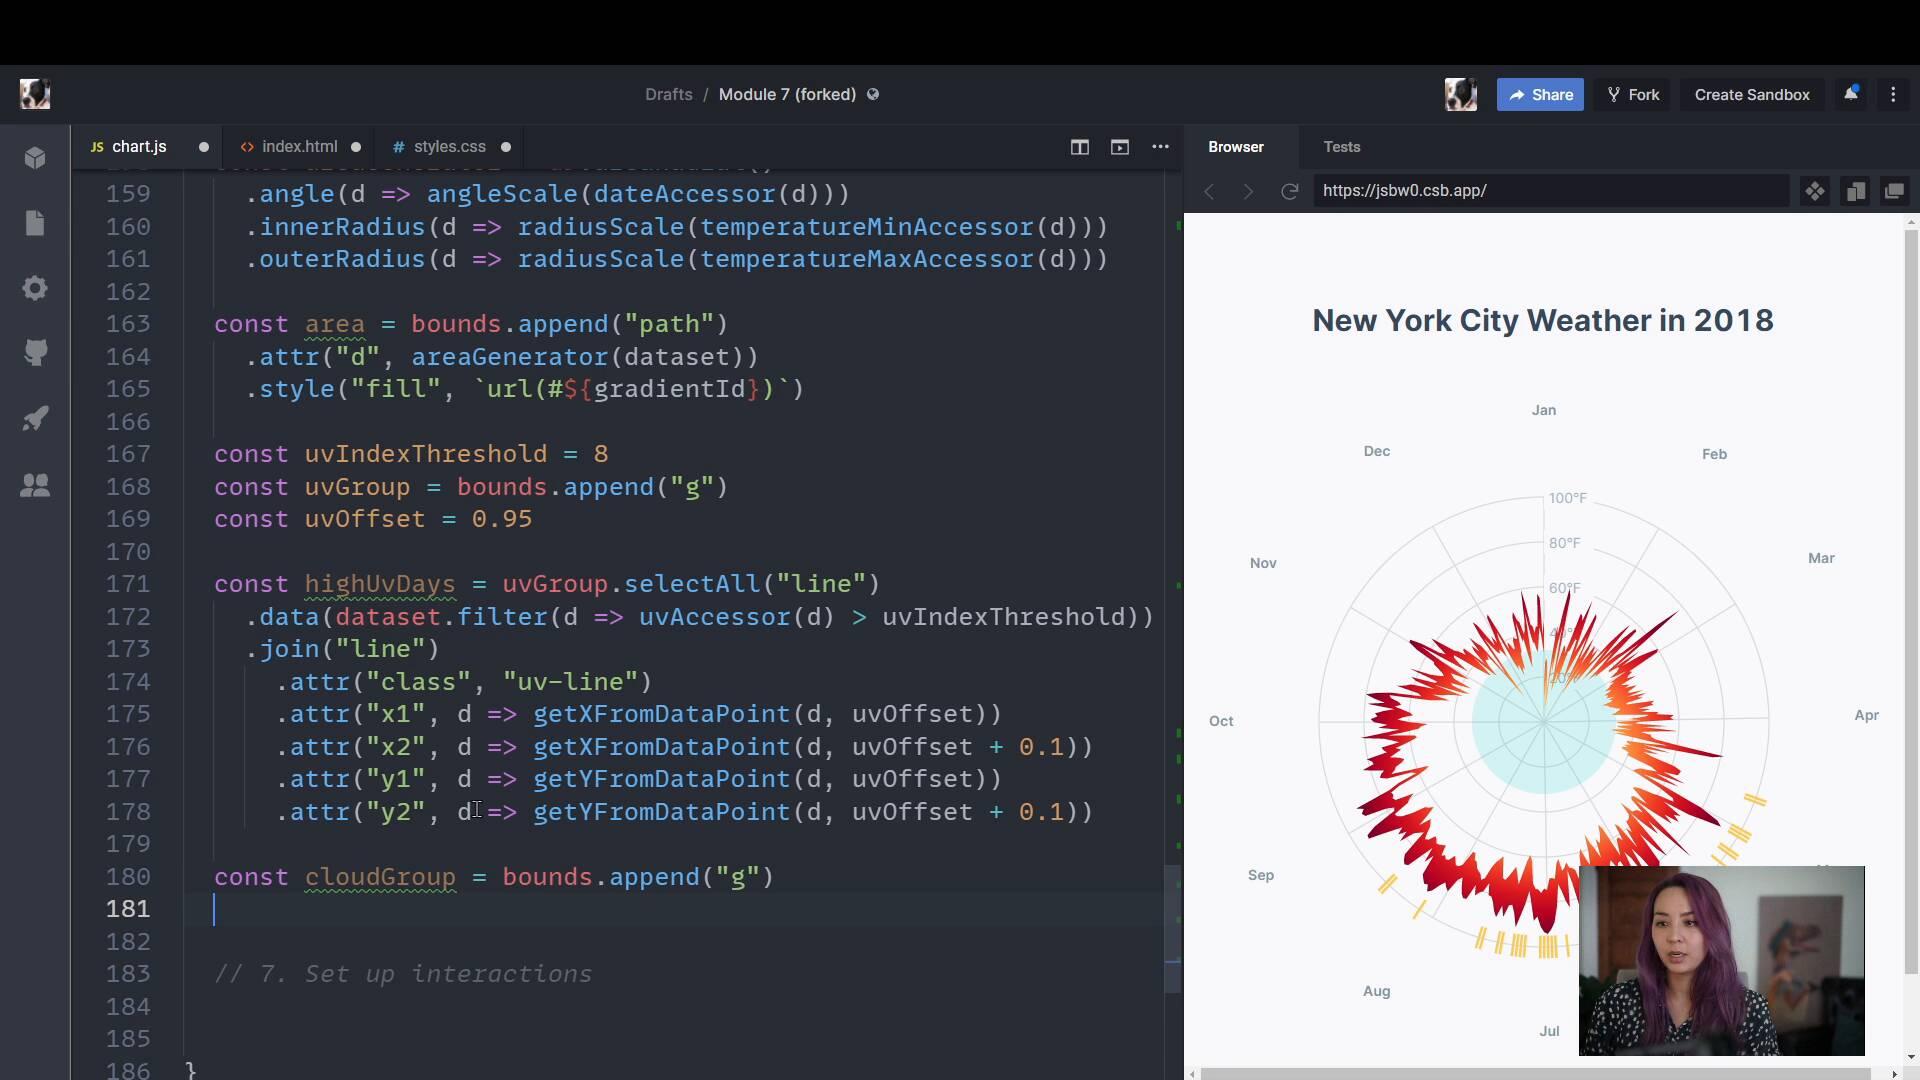
Adding the cloud cover bubblesFullstack D3 MasterclassNext, we'll add our ring of circles around the outside to represent the amount of cloud cover for each day. We'll also learn something really important about visualizing data using circles.
lesson
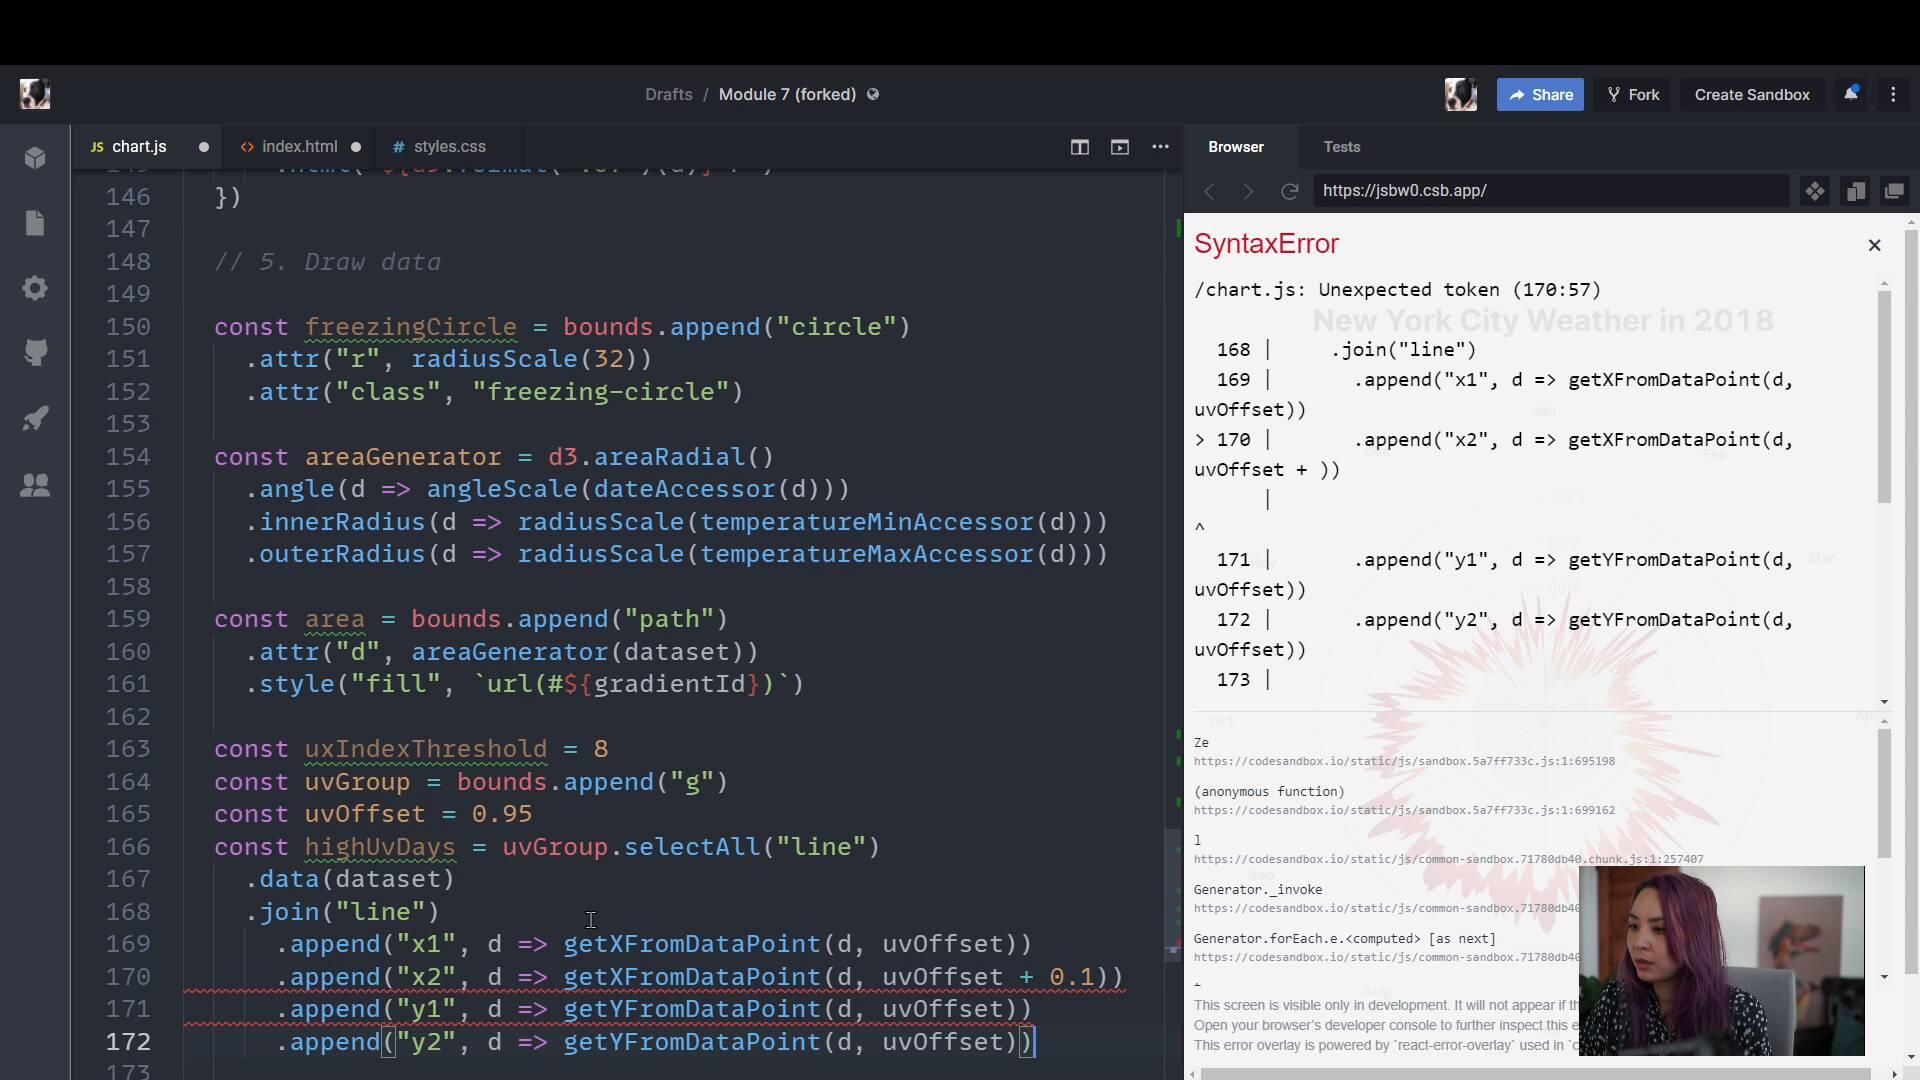
Adding the UV index marksFullstack D3 MasterclassWe add marks to show which days are above a certain UV index threshold.
lesson
Adding the temperature areaFullstack D3 MasterclassWe create a radial area shape, bounded by the min and max temperatures for each day. Then we create a gradient and use it to color our area.
lesson
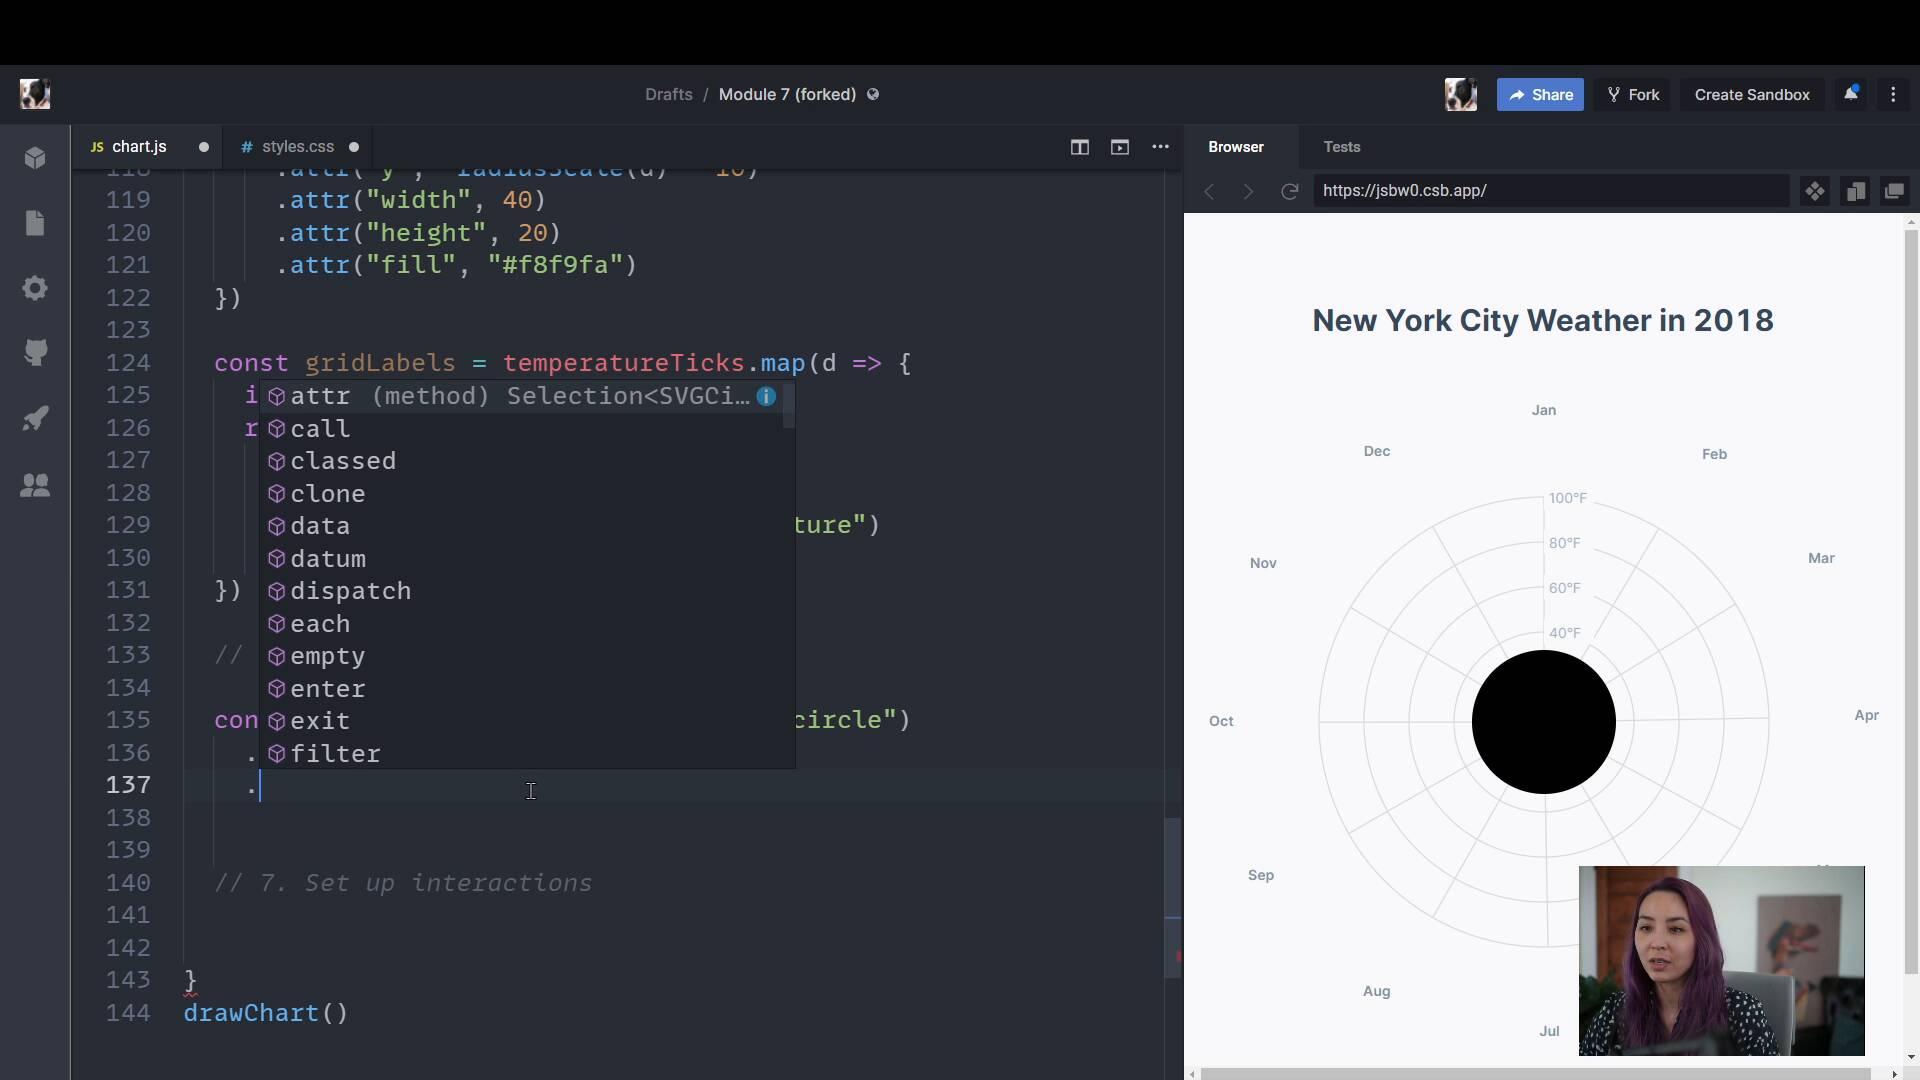
Adding freezingFullstack D3 MasterclassTo ease into our drawing data step, let's start by adding a circle that shows what temperatures are below freezing.
lesson
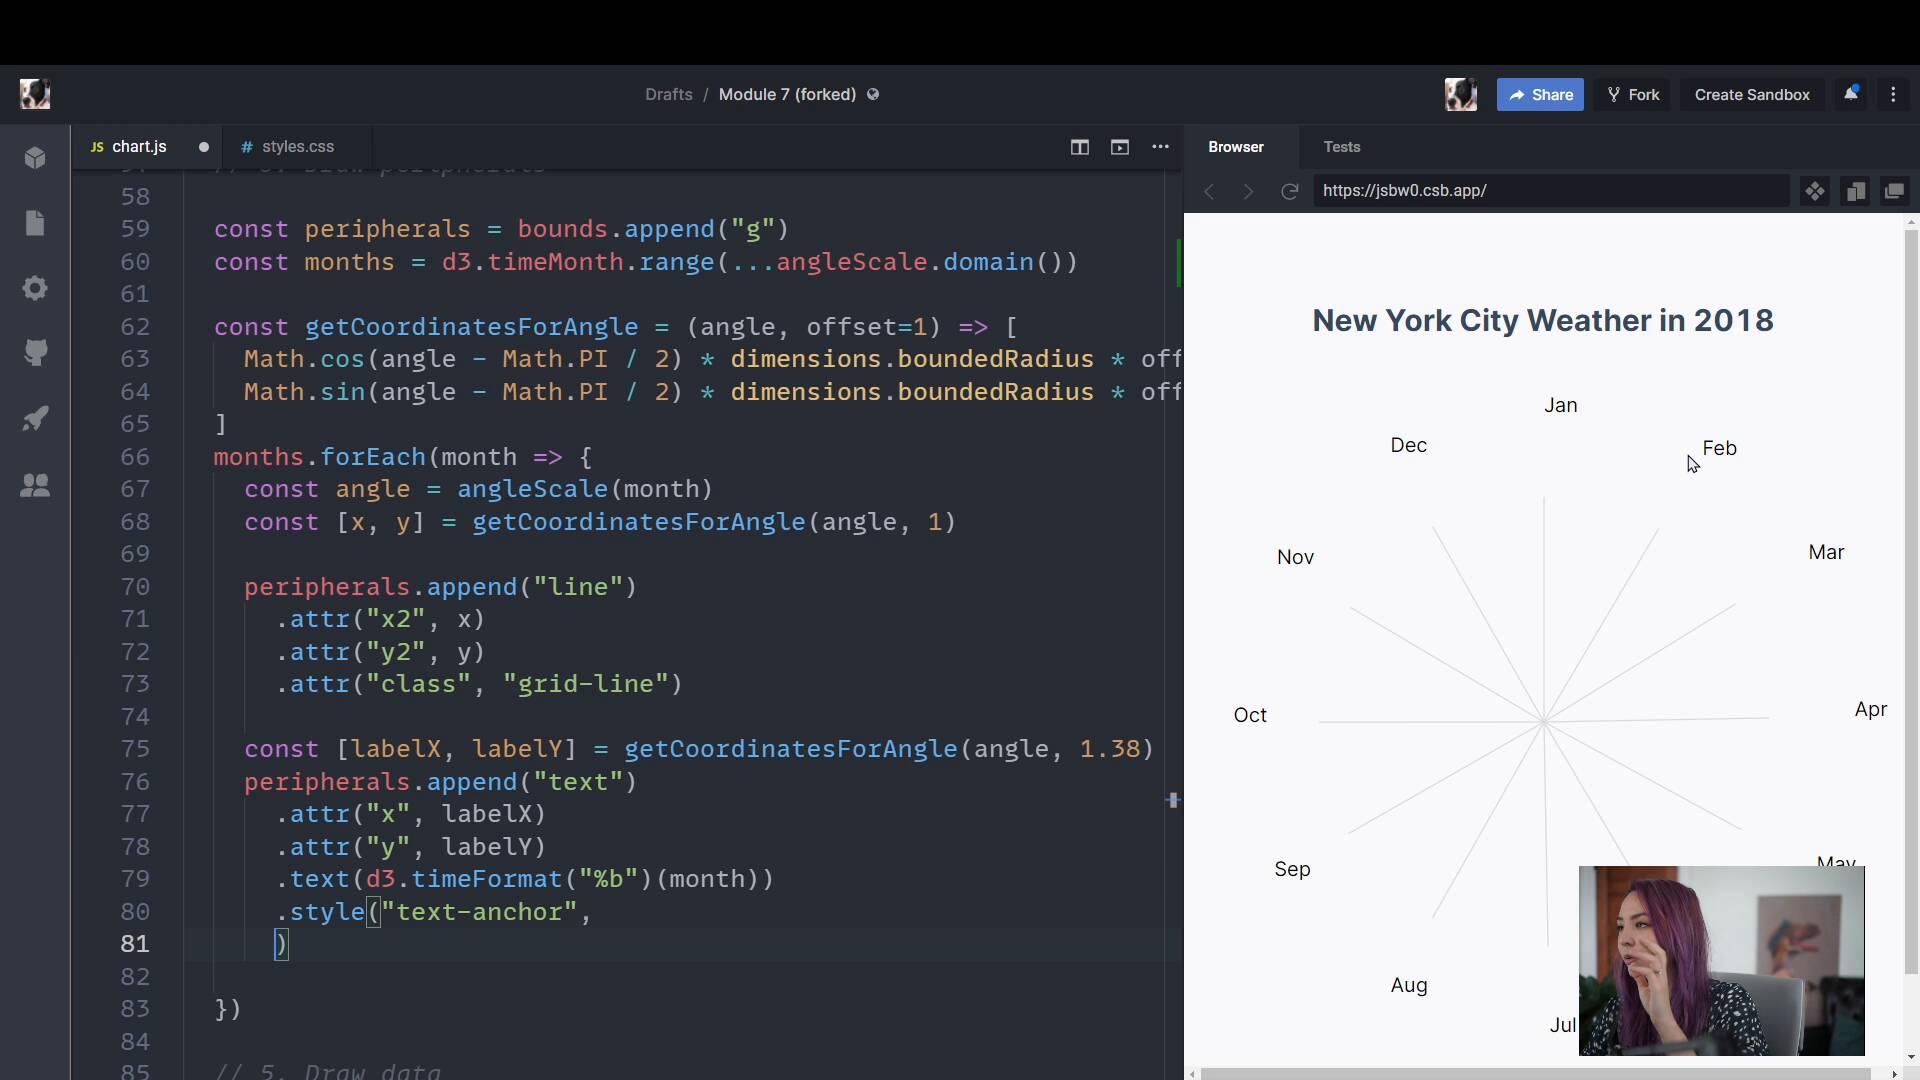
Adding gridlinesFullstack D3 MasterclassWe're going to skip step 5 and use step 6 to get our feet wet with angular math. We'll draw angular grid lines for each month, circular grid lines for temperature, and label both axes.
lesson
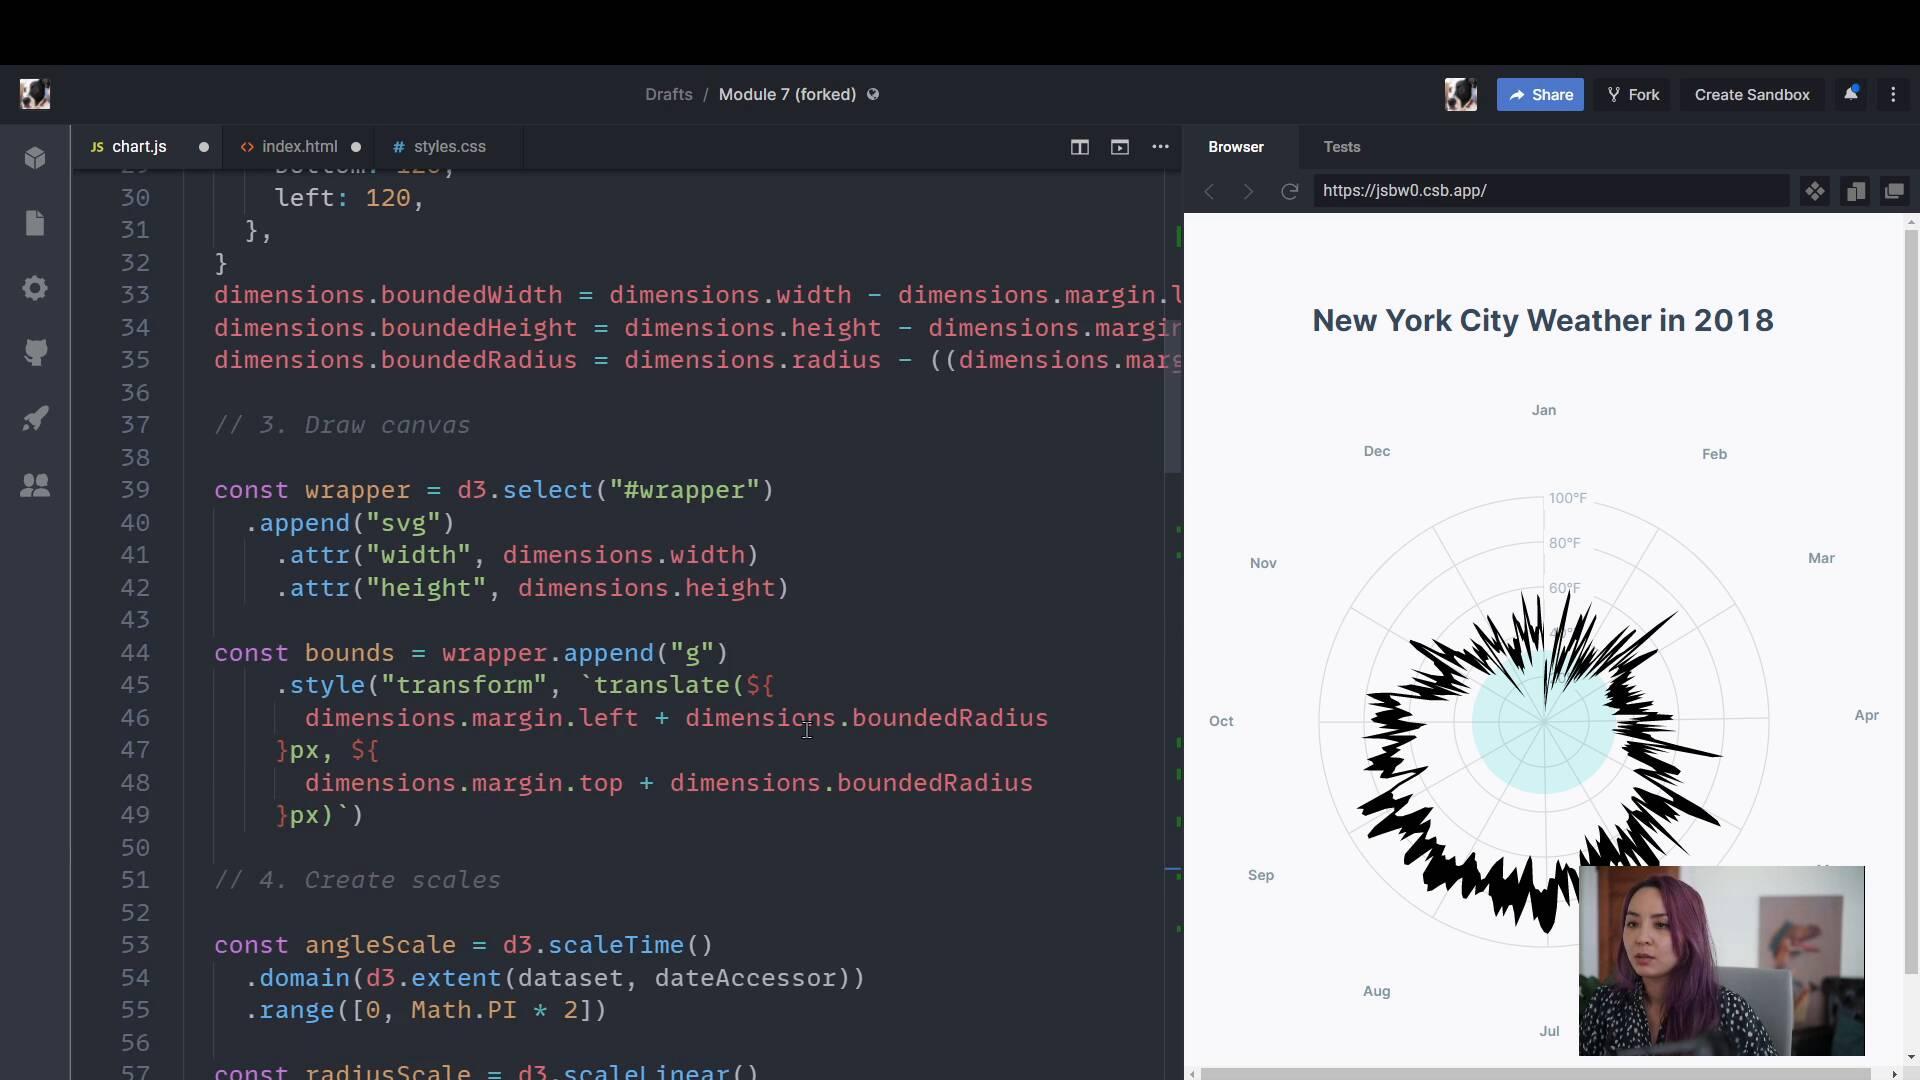
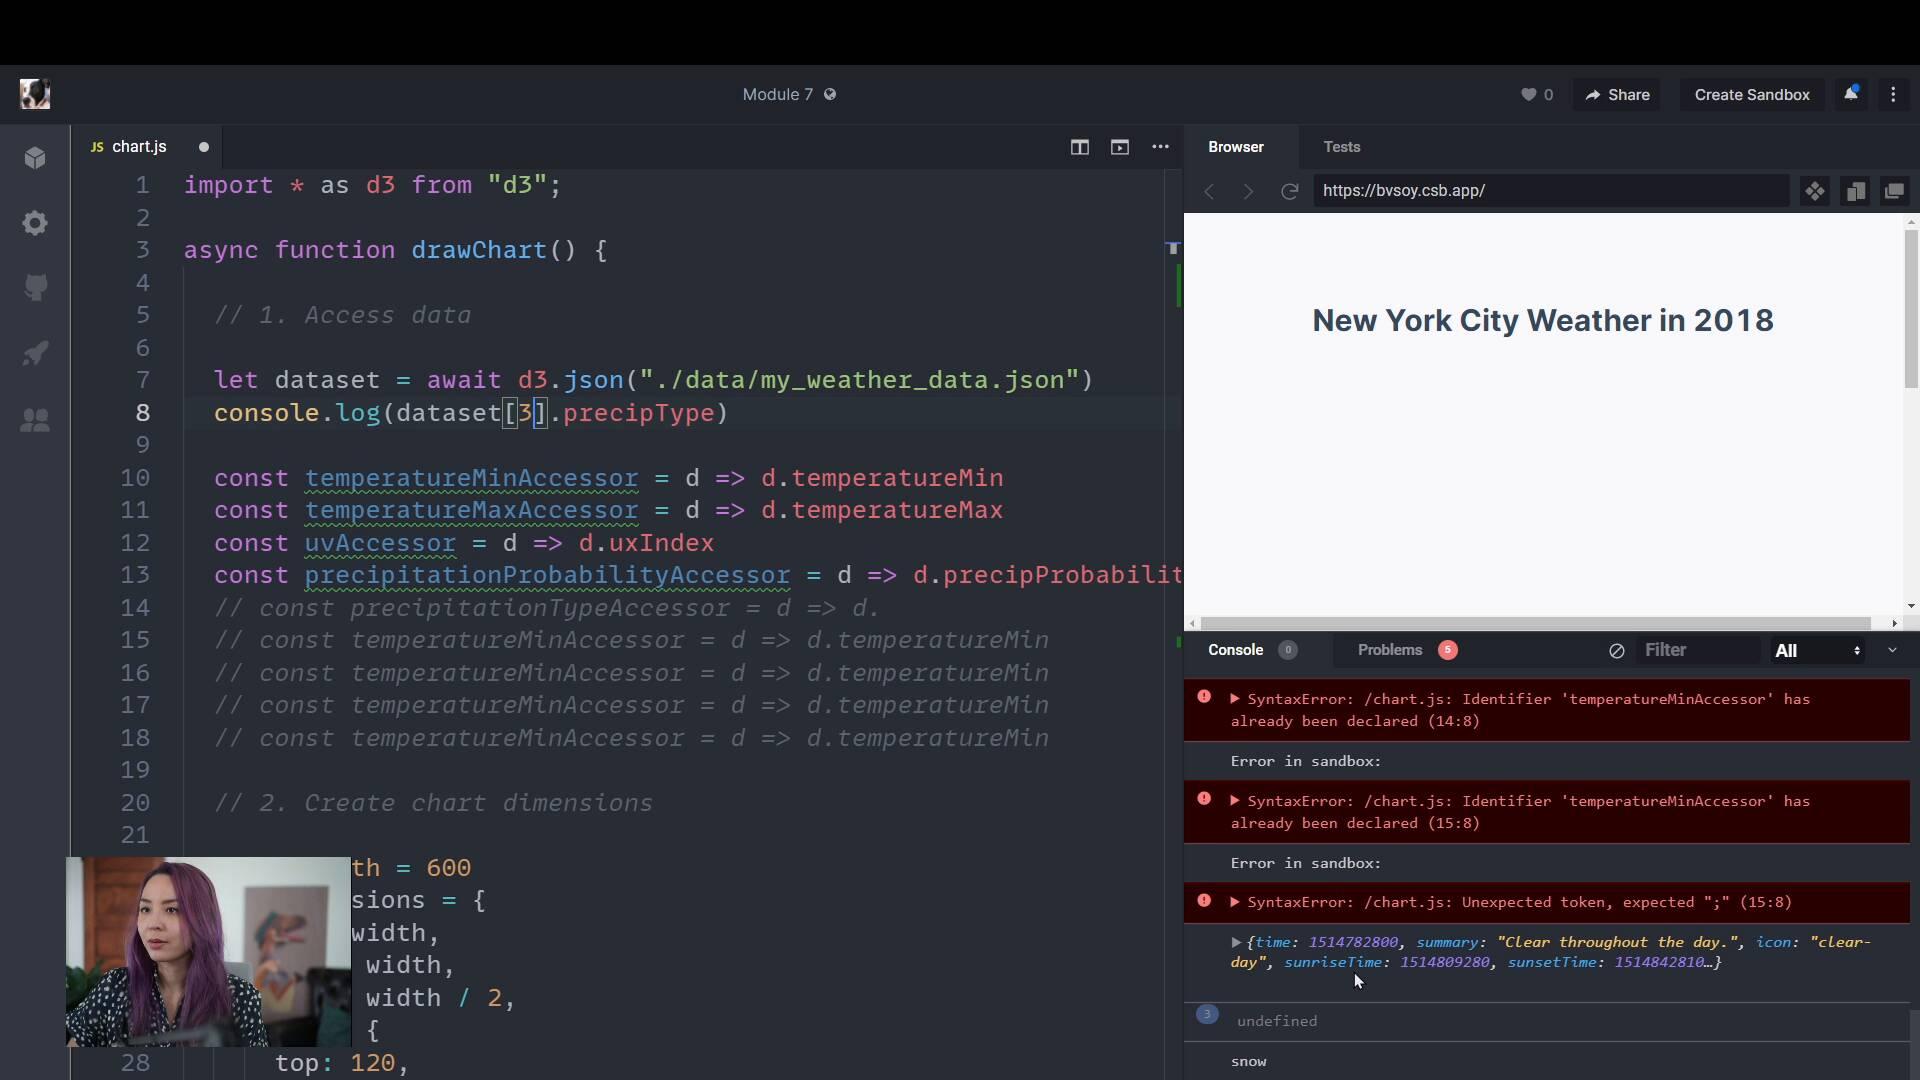
Getting set upFullstack D3 MasterclassWe're going to breeze through the first four steps: accessing our data, creating our dimensions, drawing our canvas, and creating our scales.