How to Land an AI Engineering Job in 2026
Webinar starts in
Showing results for "d3"


Lessons
view all ⭢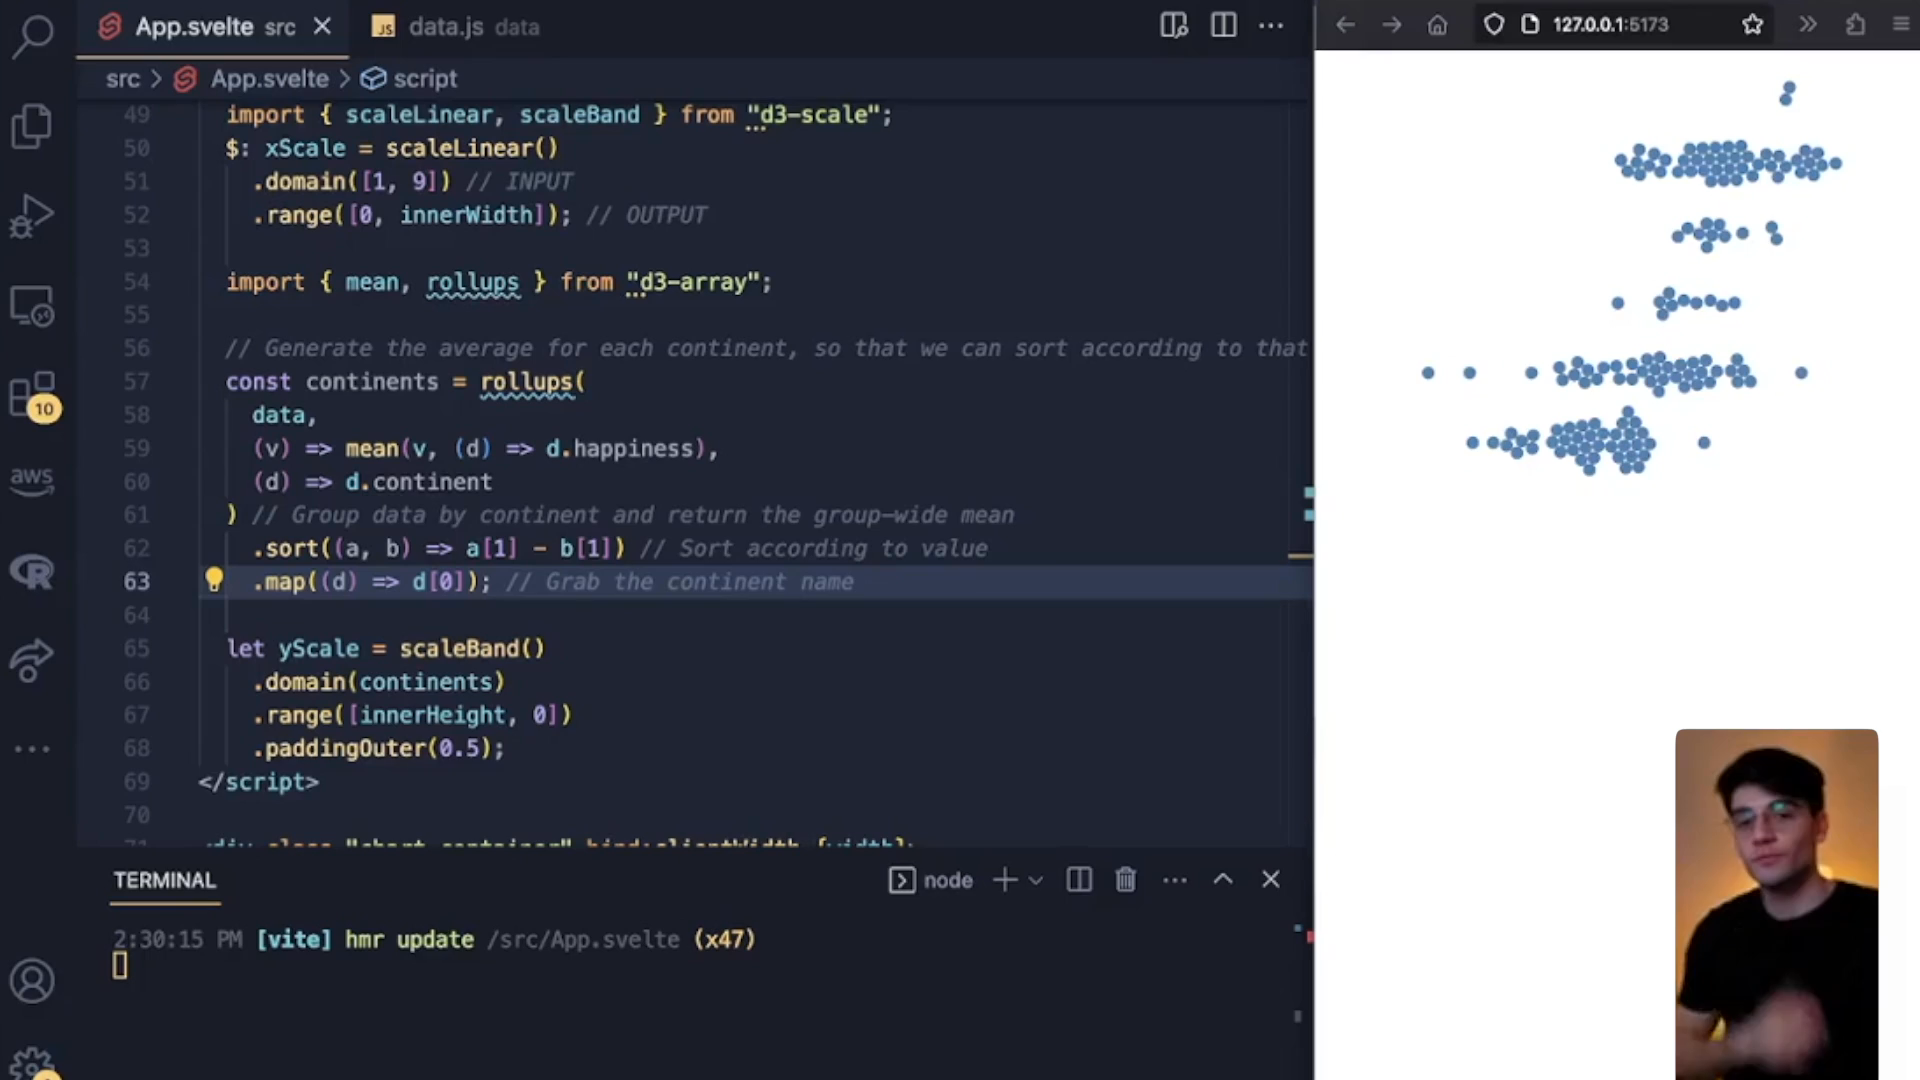
lesson
Dynamically Styling a D3 and Svelte Beeswarm ChartBuilding a Beeswarm Chart with Svelte and D3In this lesson, we will learn how to dynamically style nodes in a force layout. The color and radii of nodes, represented as circles, in a beeswarm plot will be determined by specific data dimensions and scales defined via methods (e.g., scaleOrdinal for mapping discrete values of a categorical variable to visual elements like colors) of the d3-scale module.
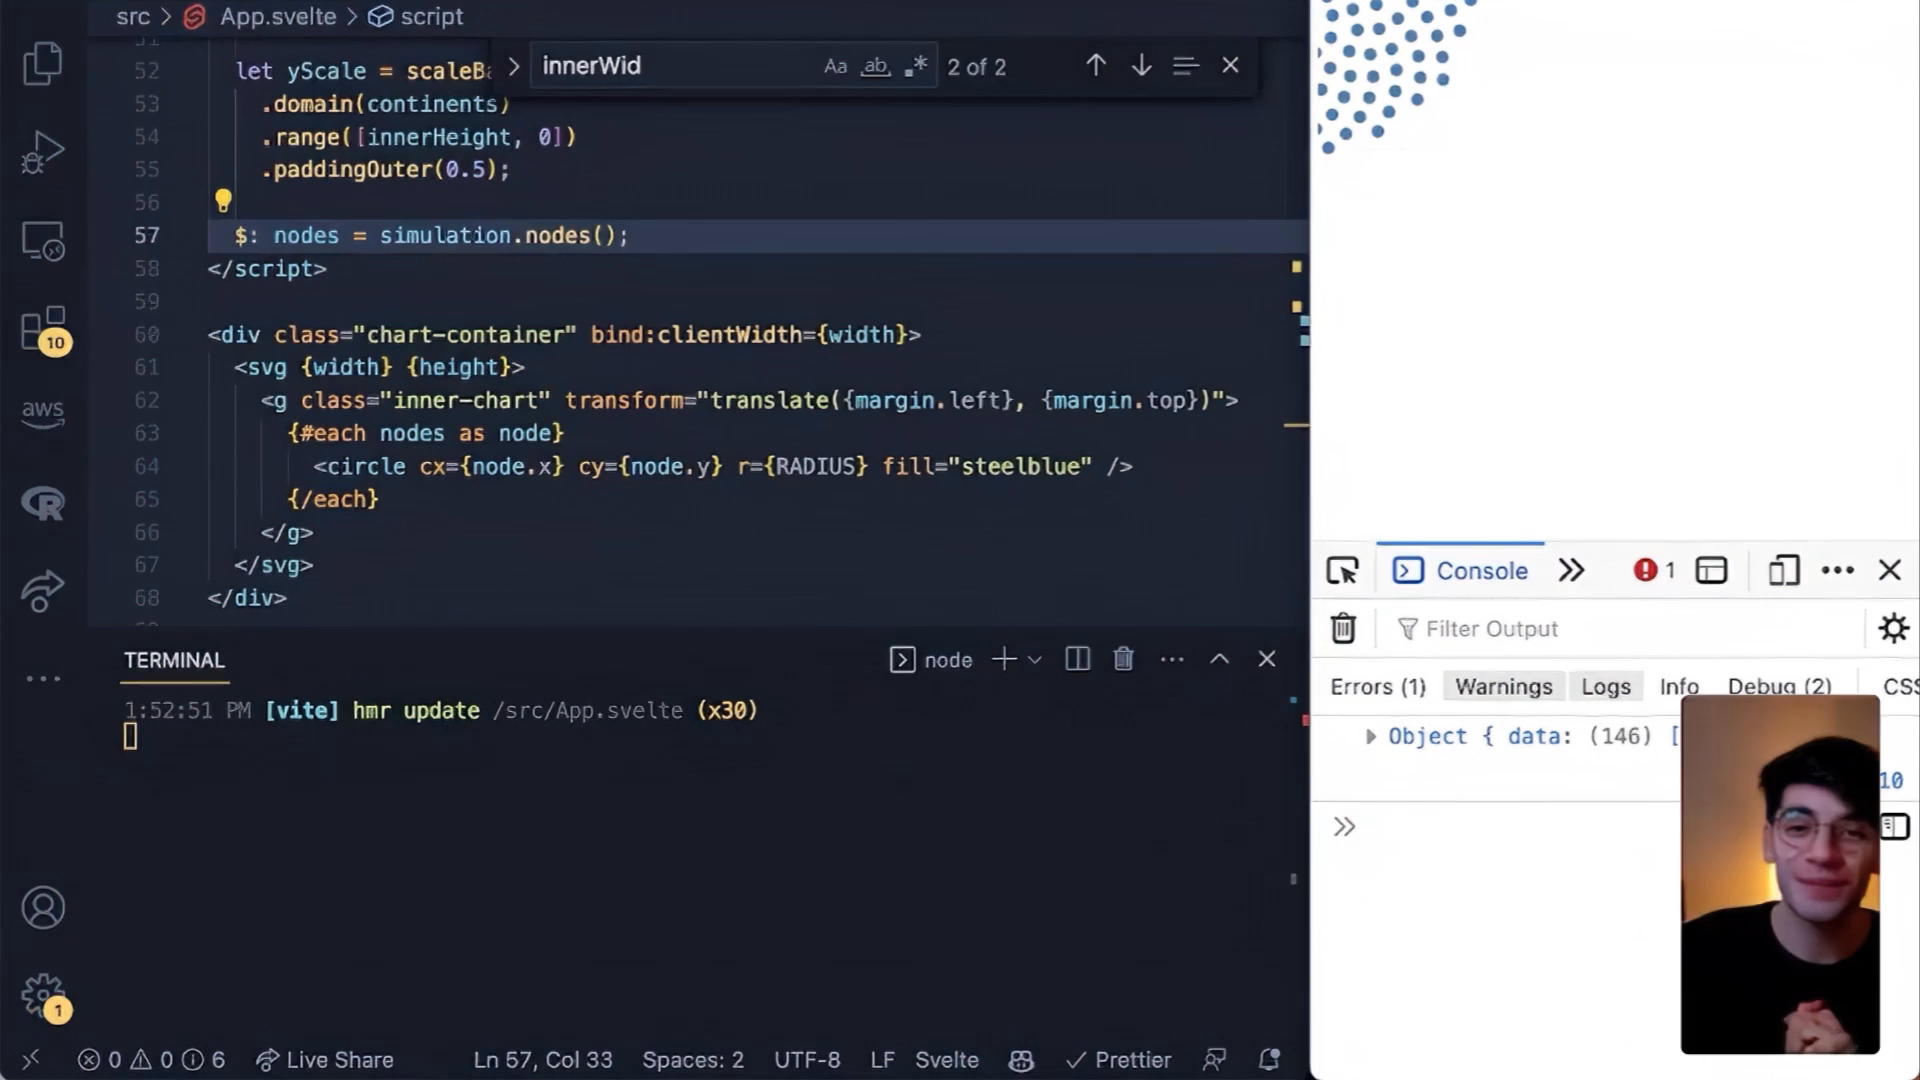
lesson
Svelte Reactivity and D3 Force Ticks in Beeswarm ChartsBuilding a Beeswarm Chart with Svelte and D3In this lesson, we will learn how ticks work in D3 force simulation layouts, and we will dive into Svelte reactivity (reactivity blocks) for correctly rendering nodes of a force layout in a responsive SVG canvas. A tick represents a “frame” in a force simulation - the state of the force layout at a specific point in a force simulation. With Svelte reactivity, nodes, represented as circles, will be positioned correctly in a beeswarm plot upon initial page load.

lesson
An Introduction to Beeswarm Charts with D3 and SvelteBuilding a Beeswarm Chart with Svelte and D3Beeswarm plots offer an elegant and interactive way to visualize distributions, outliers and patterns within datasets. In this lesson, we will cover the fundamentals of building a beeswarm plot, beginning with an in-depth explanation of force simulations in D3 data visualizations. Then, we will learn how to prepare data for a force layout via D3’s data manipulation methods (e.g., rollup), how to create a force layout with the d3-force module (to automatically position nodes, represented as circles, in clusters and avoid node collisions/overlap) and how to render nodes of the force layout in a responsive SVG canvas with Svelte.
lesson
An Introduction to the D3 Module d3-geo for Svelte ChartsBetter Data Visualizations with SvelteAn introduction to d3-geo
lesson
An introduction to d3-force for Svelte VisualizationsBetter Data Visualizations with SvelteAn introduction to `d3-force`
lesson
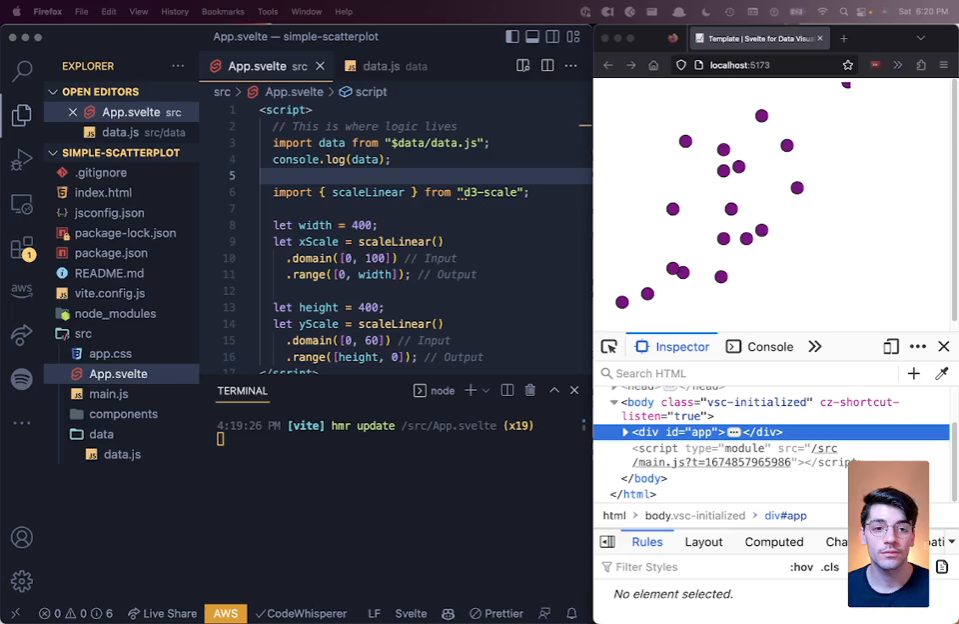
Draw Axes, Gridlines, and Labels With Svelte + D3.jsBetter Data Visualizations with SvelteUsing Svelte and D3 to draw axes, gridlines, and labels
lesson
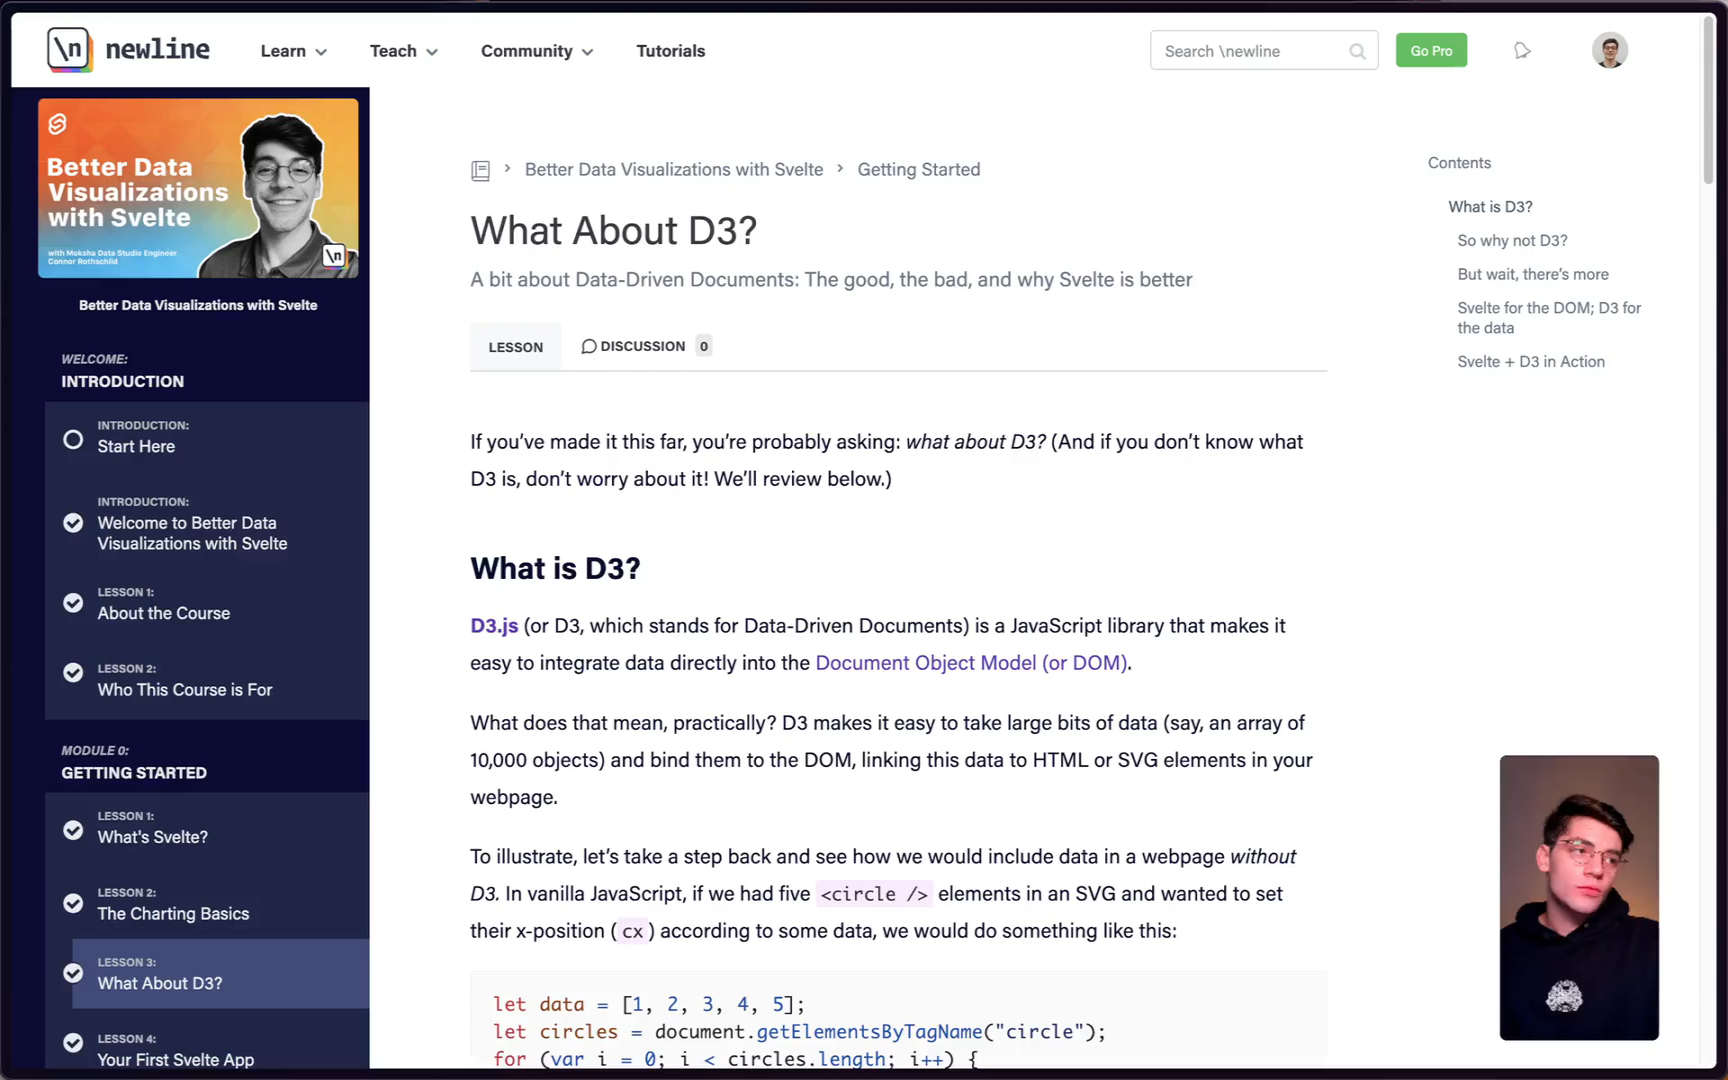
How D3.js and Svelte Complement Each OtherBetter Data Visualizations with SvelteA bit about Data-Driven Documents: The good, the bad, and why Svelte is better
lesson
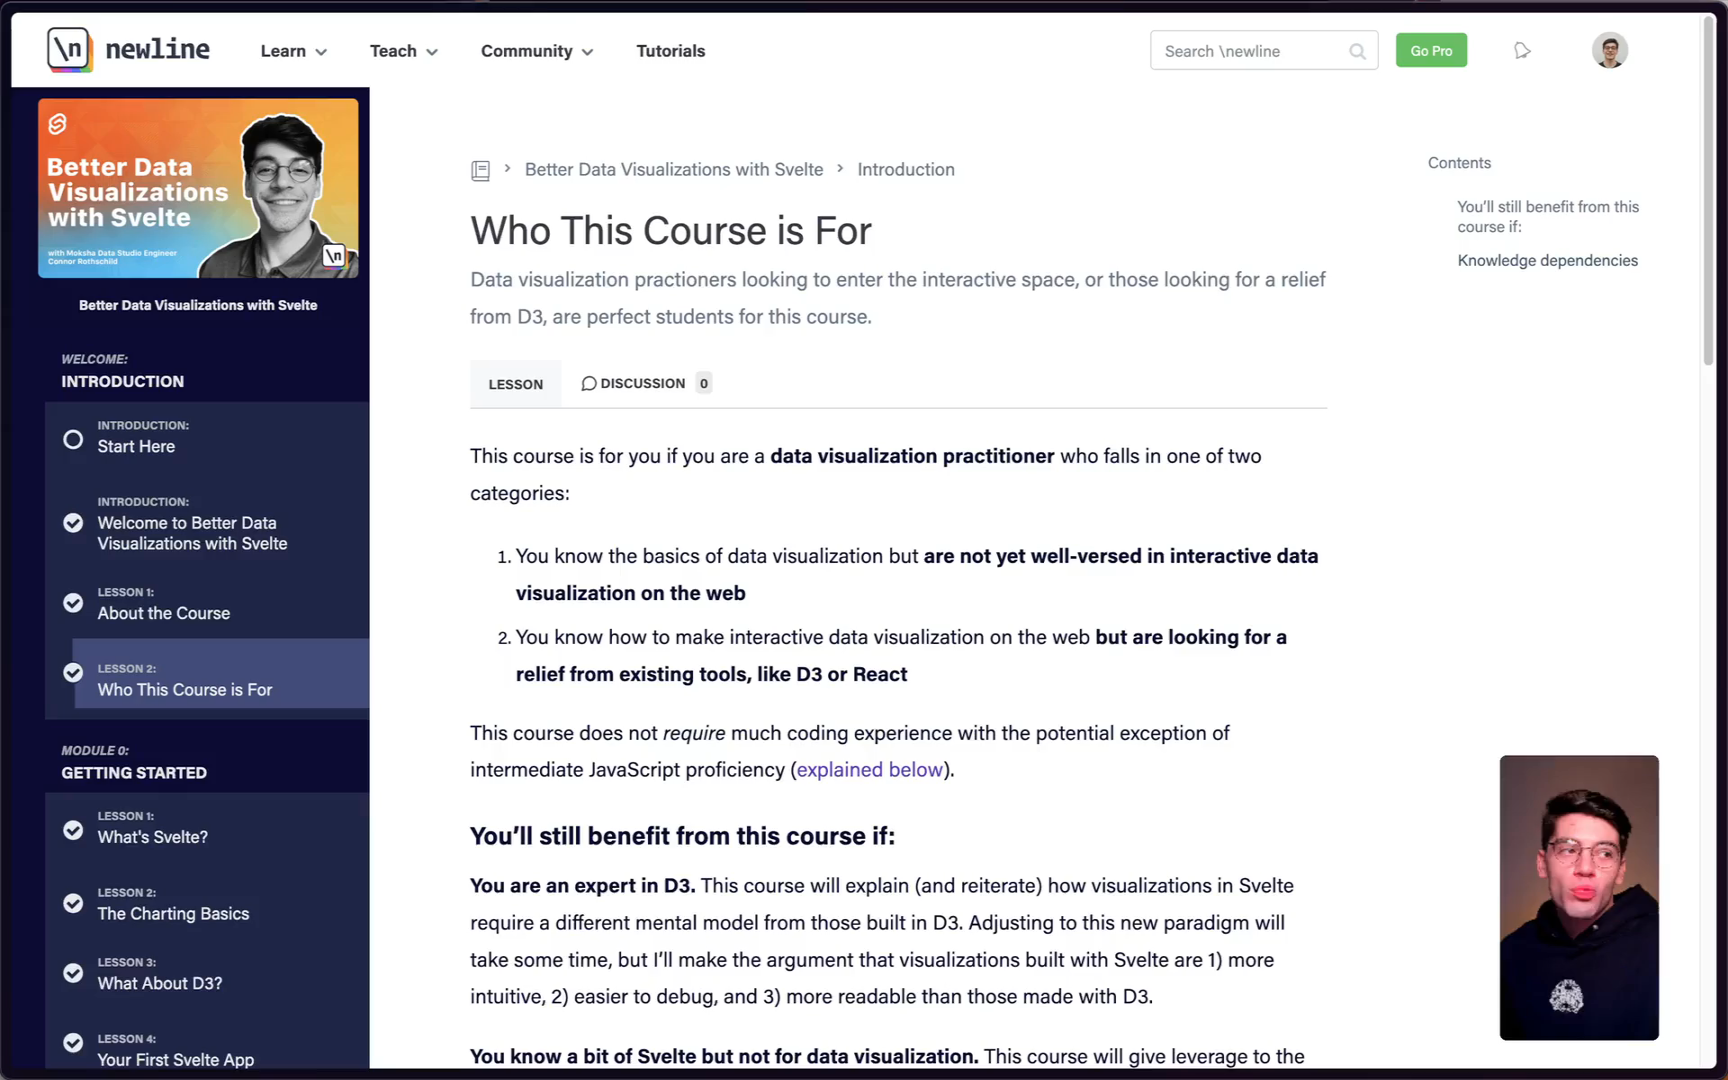
Why Use Svelte for Data Visualization Versus D3Better Data Visualizations with SvelteData visualization practitioners looking to enter the interactive space, or those looking for a relief from D3, are perfect students for this course.
lesson
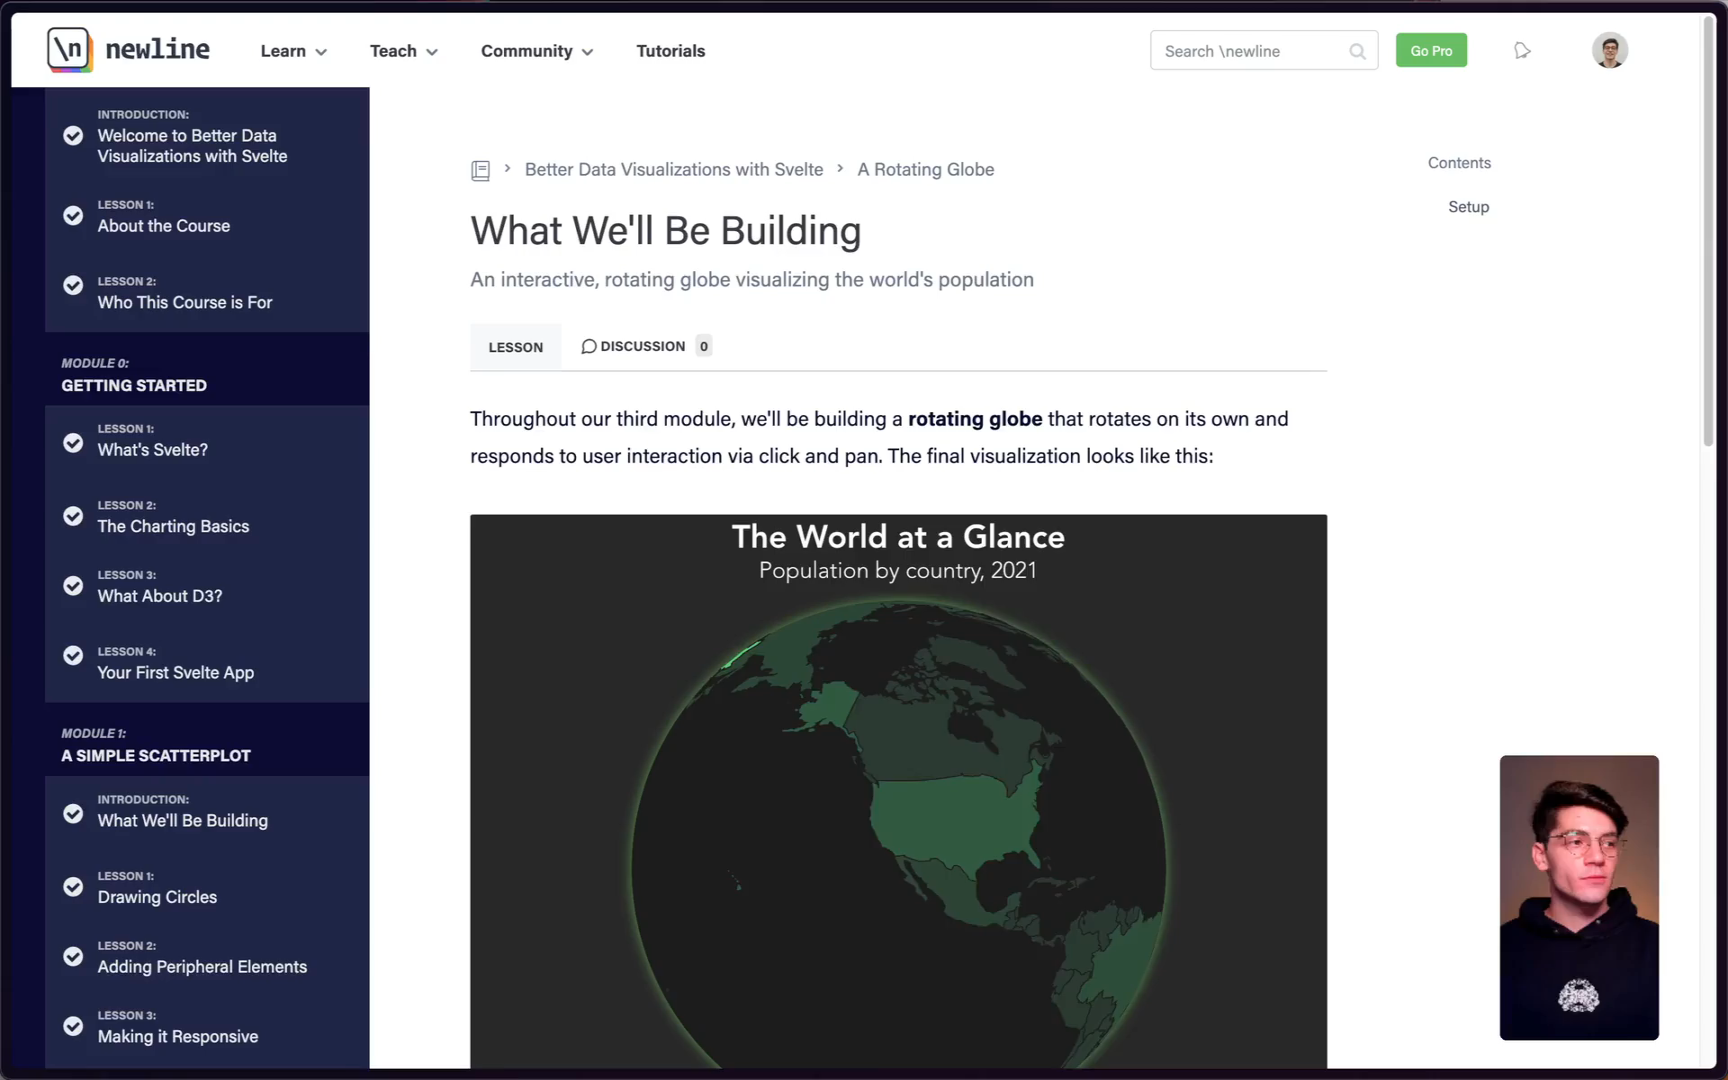
Create an Interactive Globe Visualization With Svelte + D3.jsBetter Data Visualizations with SvelteAn interactive, rotating globe visualizing the world's population
lesson
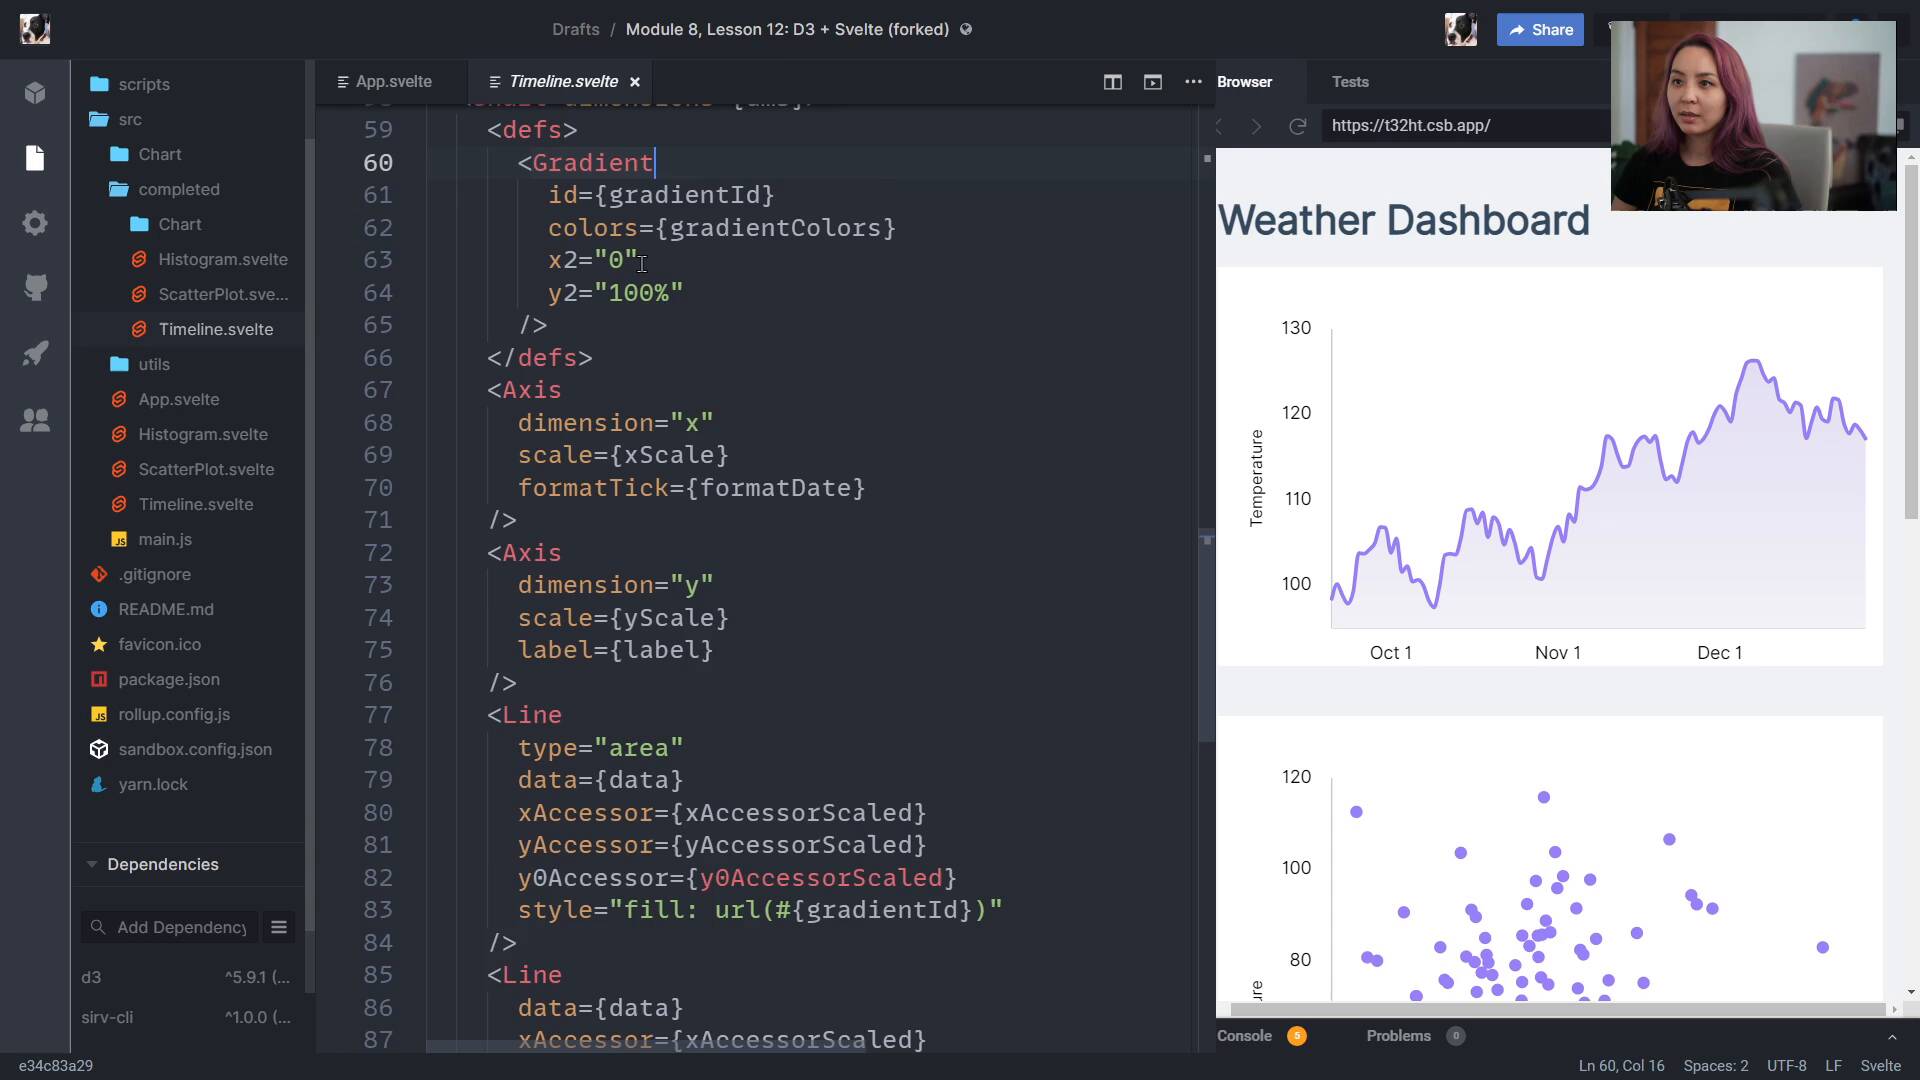
Using d3 with Svelte.jsFullstack D3 MasterclassWe take a look at how to combine d3 + Svelte.js, with a complete codebase.
lesson
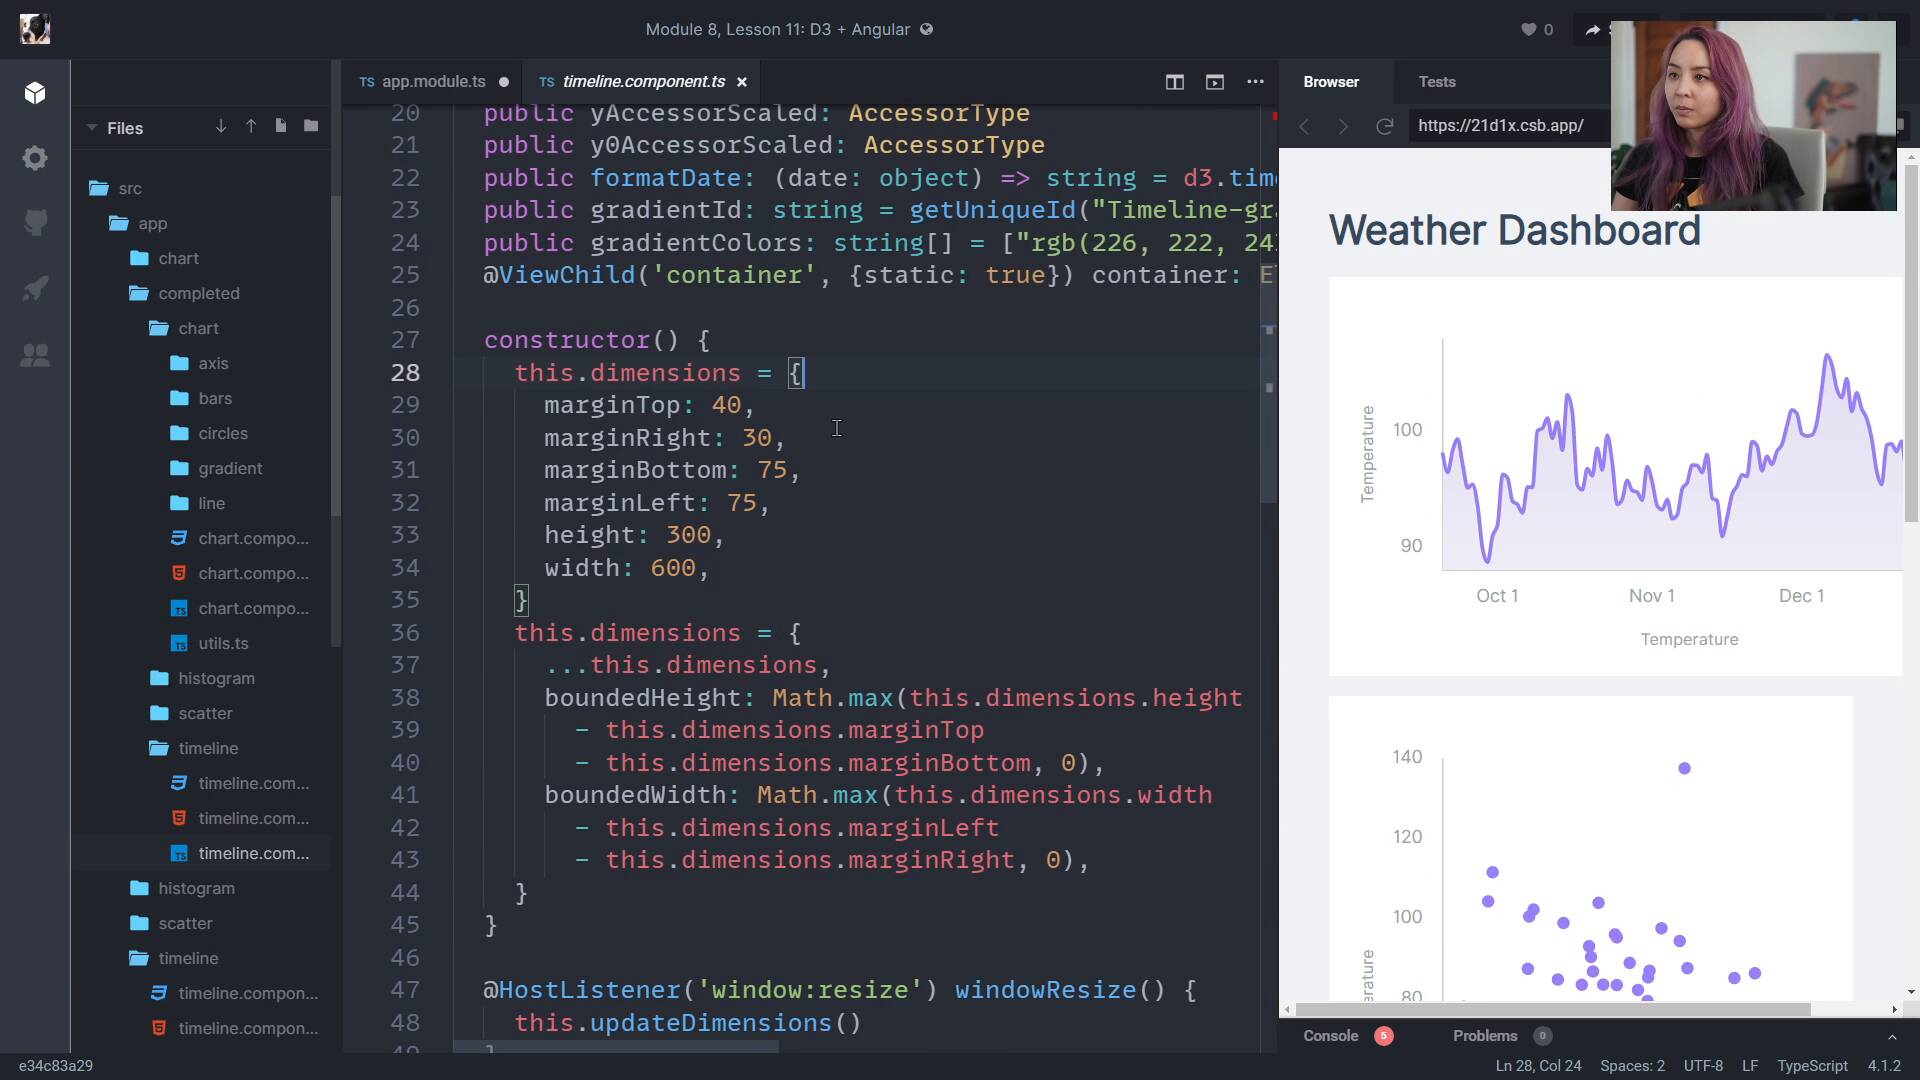
Using d3 with Angular.jsFullstack D3 MasterclassWe take a look at how to combine d3 + Angular, with a complete codebase.
lesson
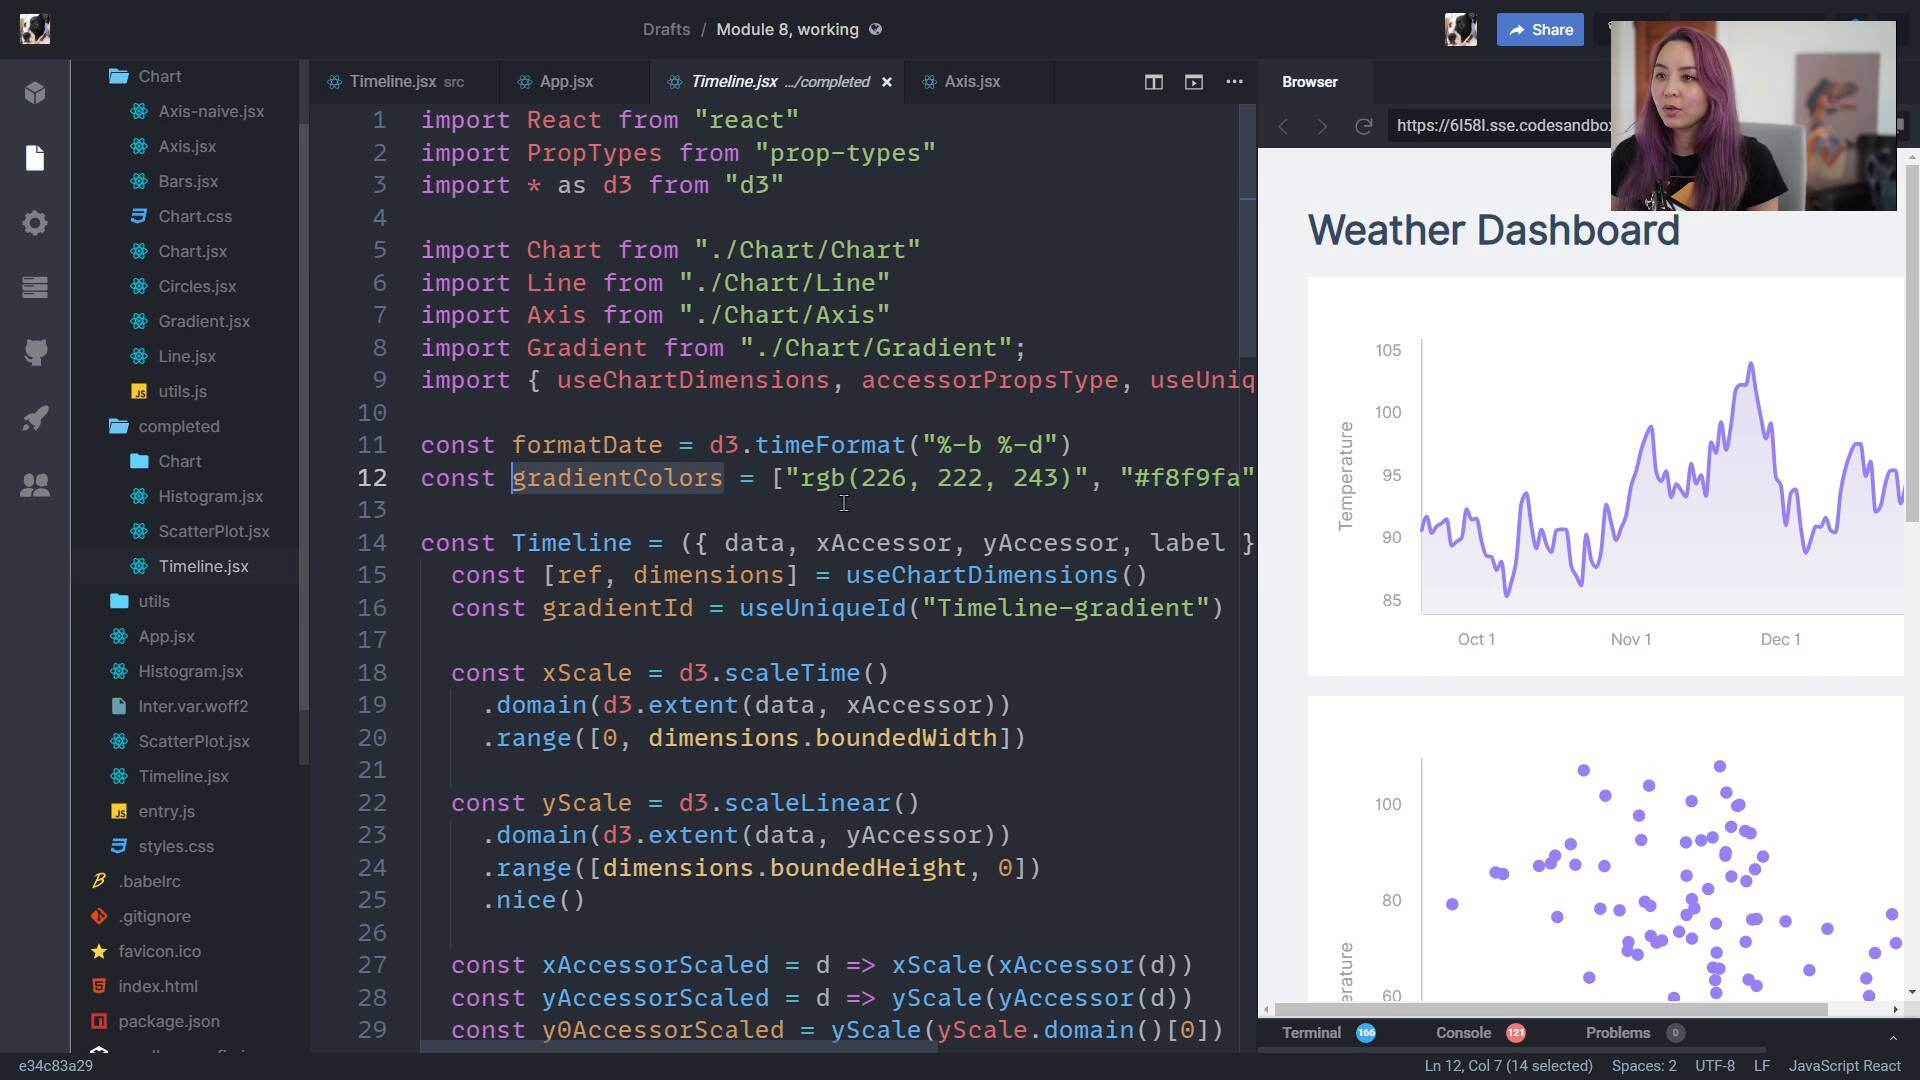
Setting up interactions in React, and wrapping upFullstack D3 MasterclassWe wrap up by talking about how to add interactions and look at the completed code for a Timeline, Scatter plot, and Histogram.
Articles
view all ⭢Building a Bar Chart Race with D3 and Svelte
In this article, we will create a data visualization that animates the change...
Building a Choropleth Map with D3 and Svelte
In this article, we will create a data visualization that displays the ratio ...
Building a Word Cloud with D3 and Svelte
In this article, we will create a data visualization that displays the freque...
Wonders of React D3 – How to get started!
📰 In this post, we will take a close look at D3, and how it enables us to vis...