

Lessons
view all ⭢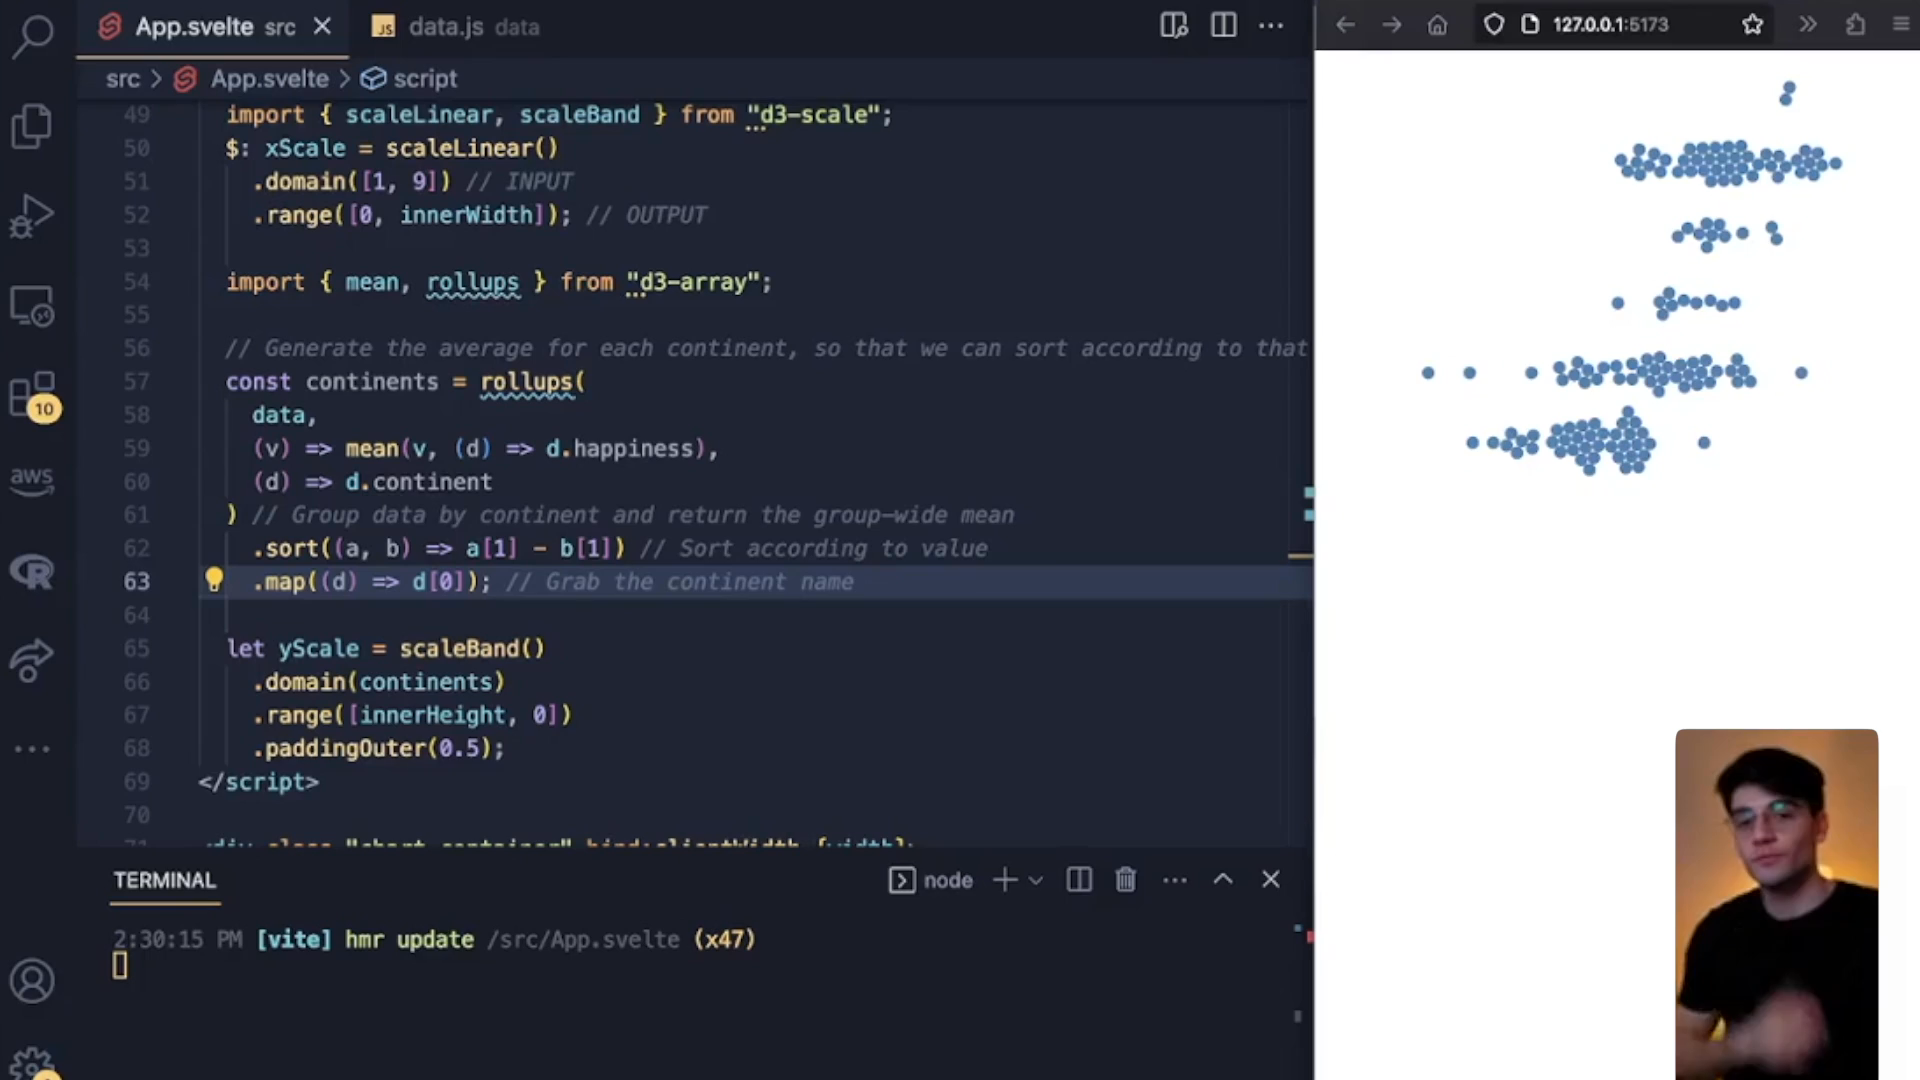
lesson
Dynamically Styling a D3 and Svelte Beeswarm ChartBuilding a Beeswarm Chart with Svelte and D3In this lesson, we will learn how to dynamically style nodes in a force layout. The color and radii of nodes, represented as circles, in a beeswarm plot will be determined by specific data dimensions and scales defined via methods (e.g., scaleOrdinal for mapping discrete values of a categorical variable to visual elements like colors) of the d3-scale module.
lesson
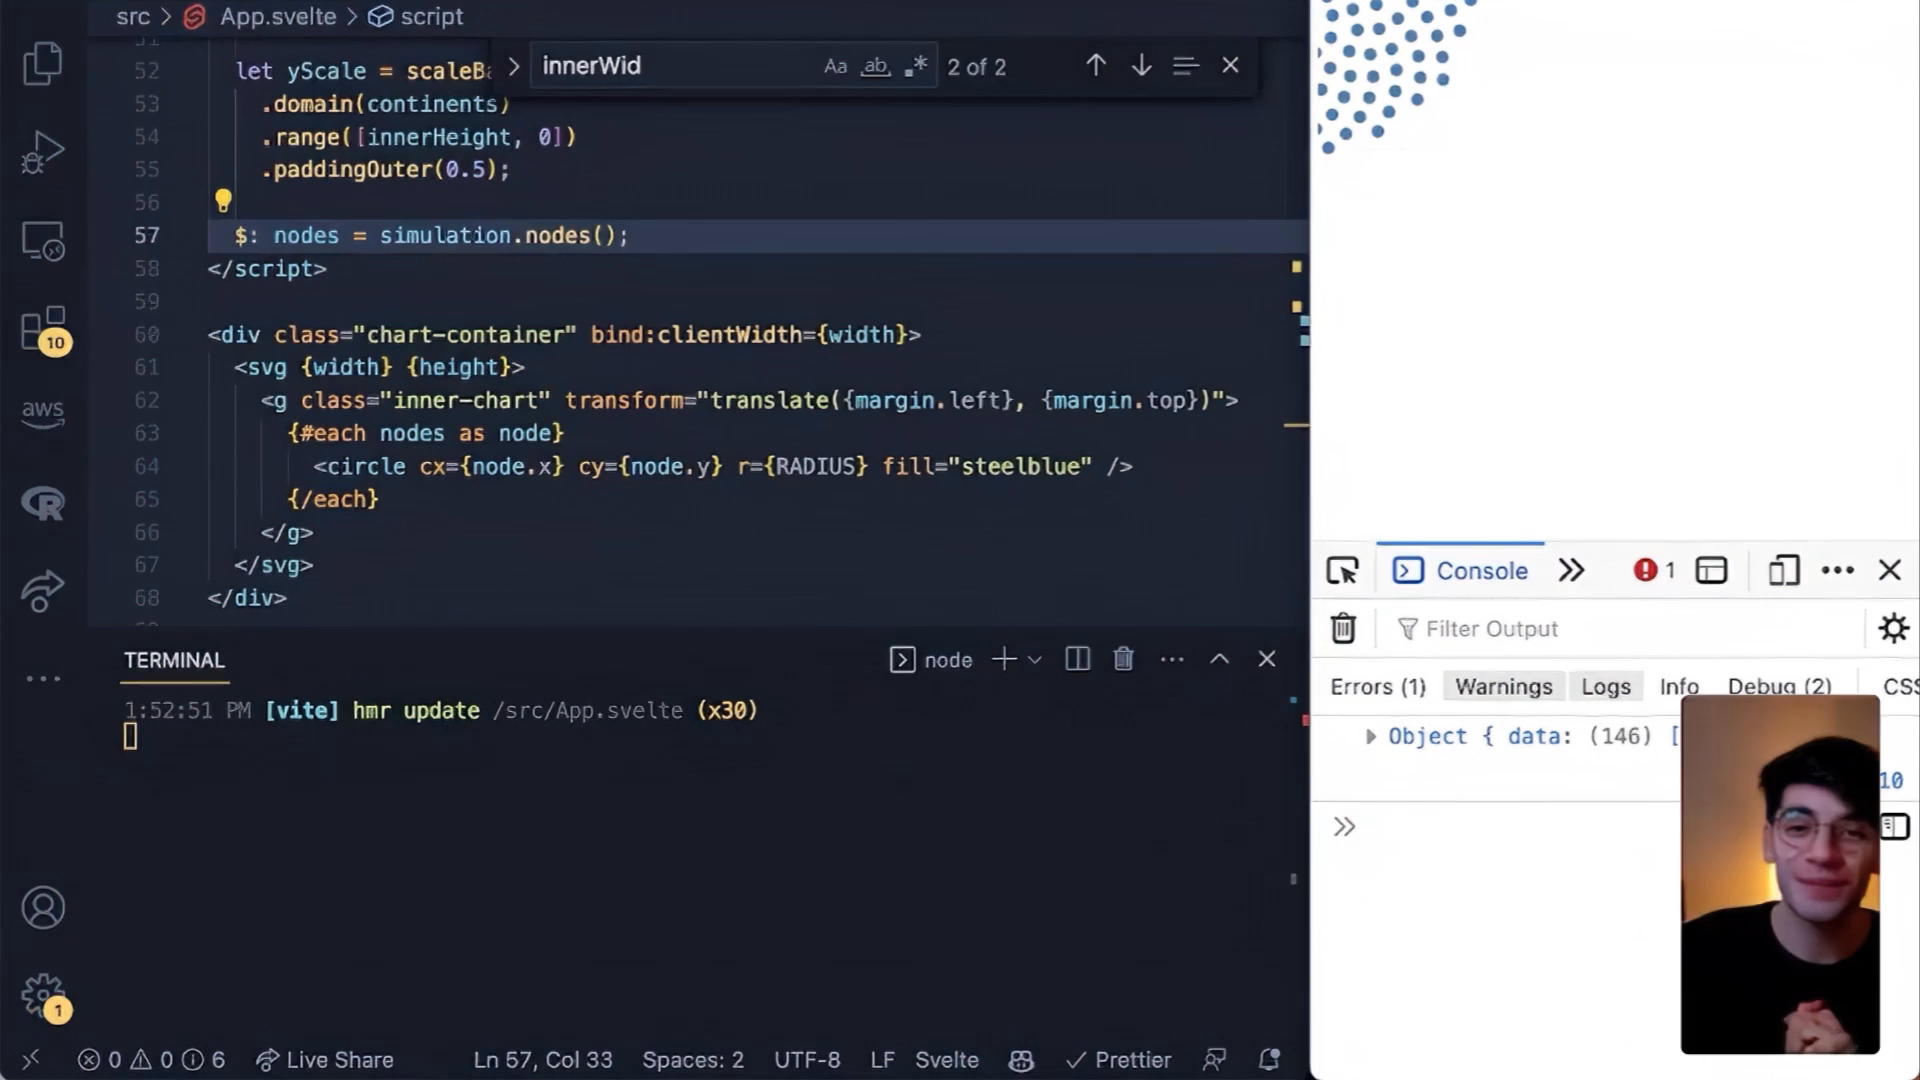
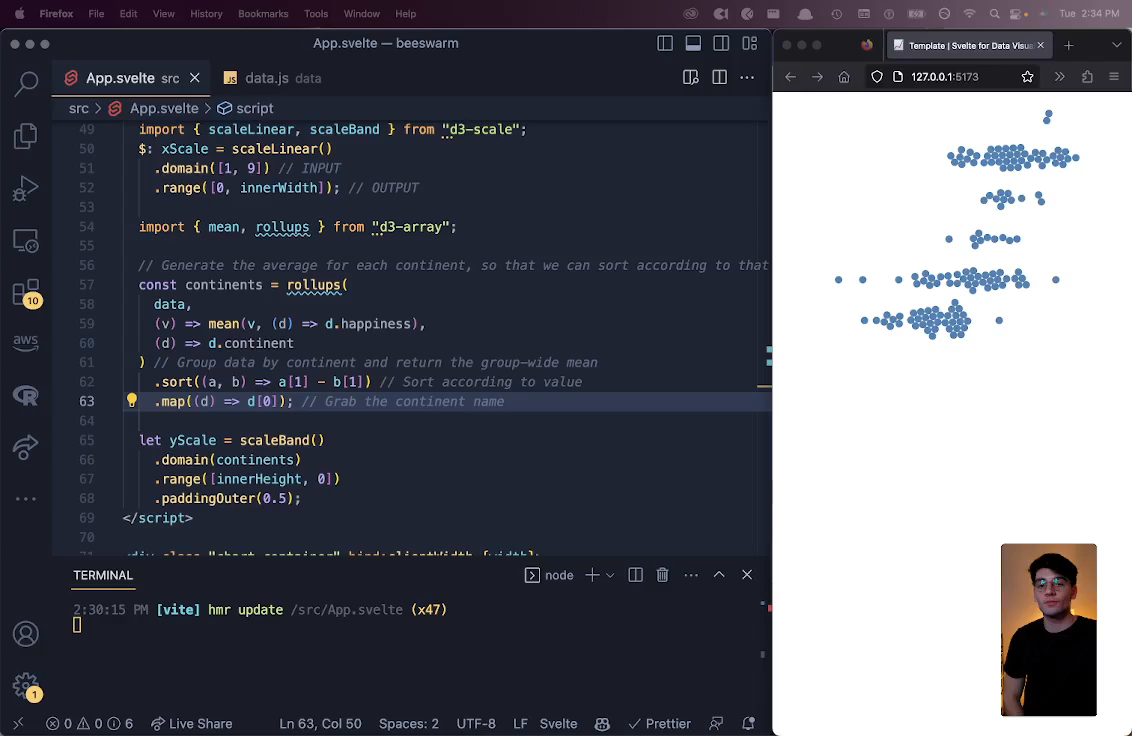
Svelte Reactivity and D3 Force Ticks in Beeswarm ChartsBuilding a Beeswarm Chart with Svelte and D3In this lesson, we will learn how ticks work in D3 force simulation layouts, and we will dive into Svelte reactivity (reactivity blocks) for correctly rendering nodes of a force layout in a responsive SVG canvas. A tick represents a “frame” in a force simulation - the state of the force layout at a specific point in a force simulation. With Svelte reactivity, nodes, represented as circles, will be positioned correctly in a beeswarm plot upon initial page load.

lesson
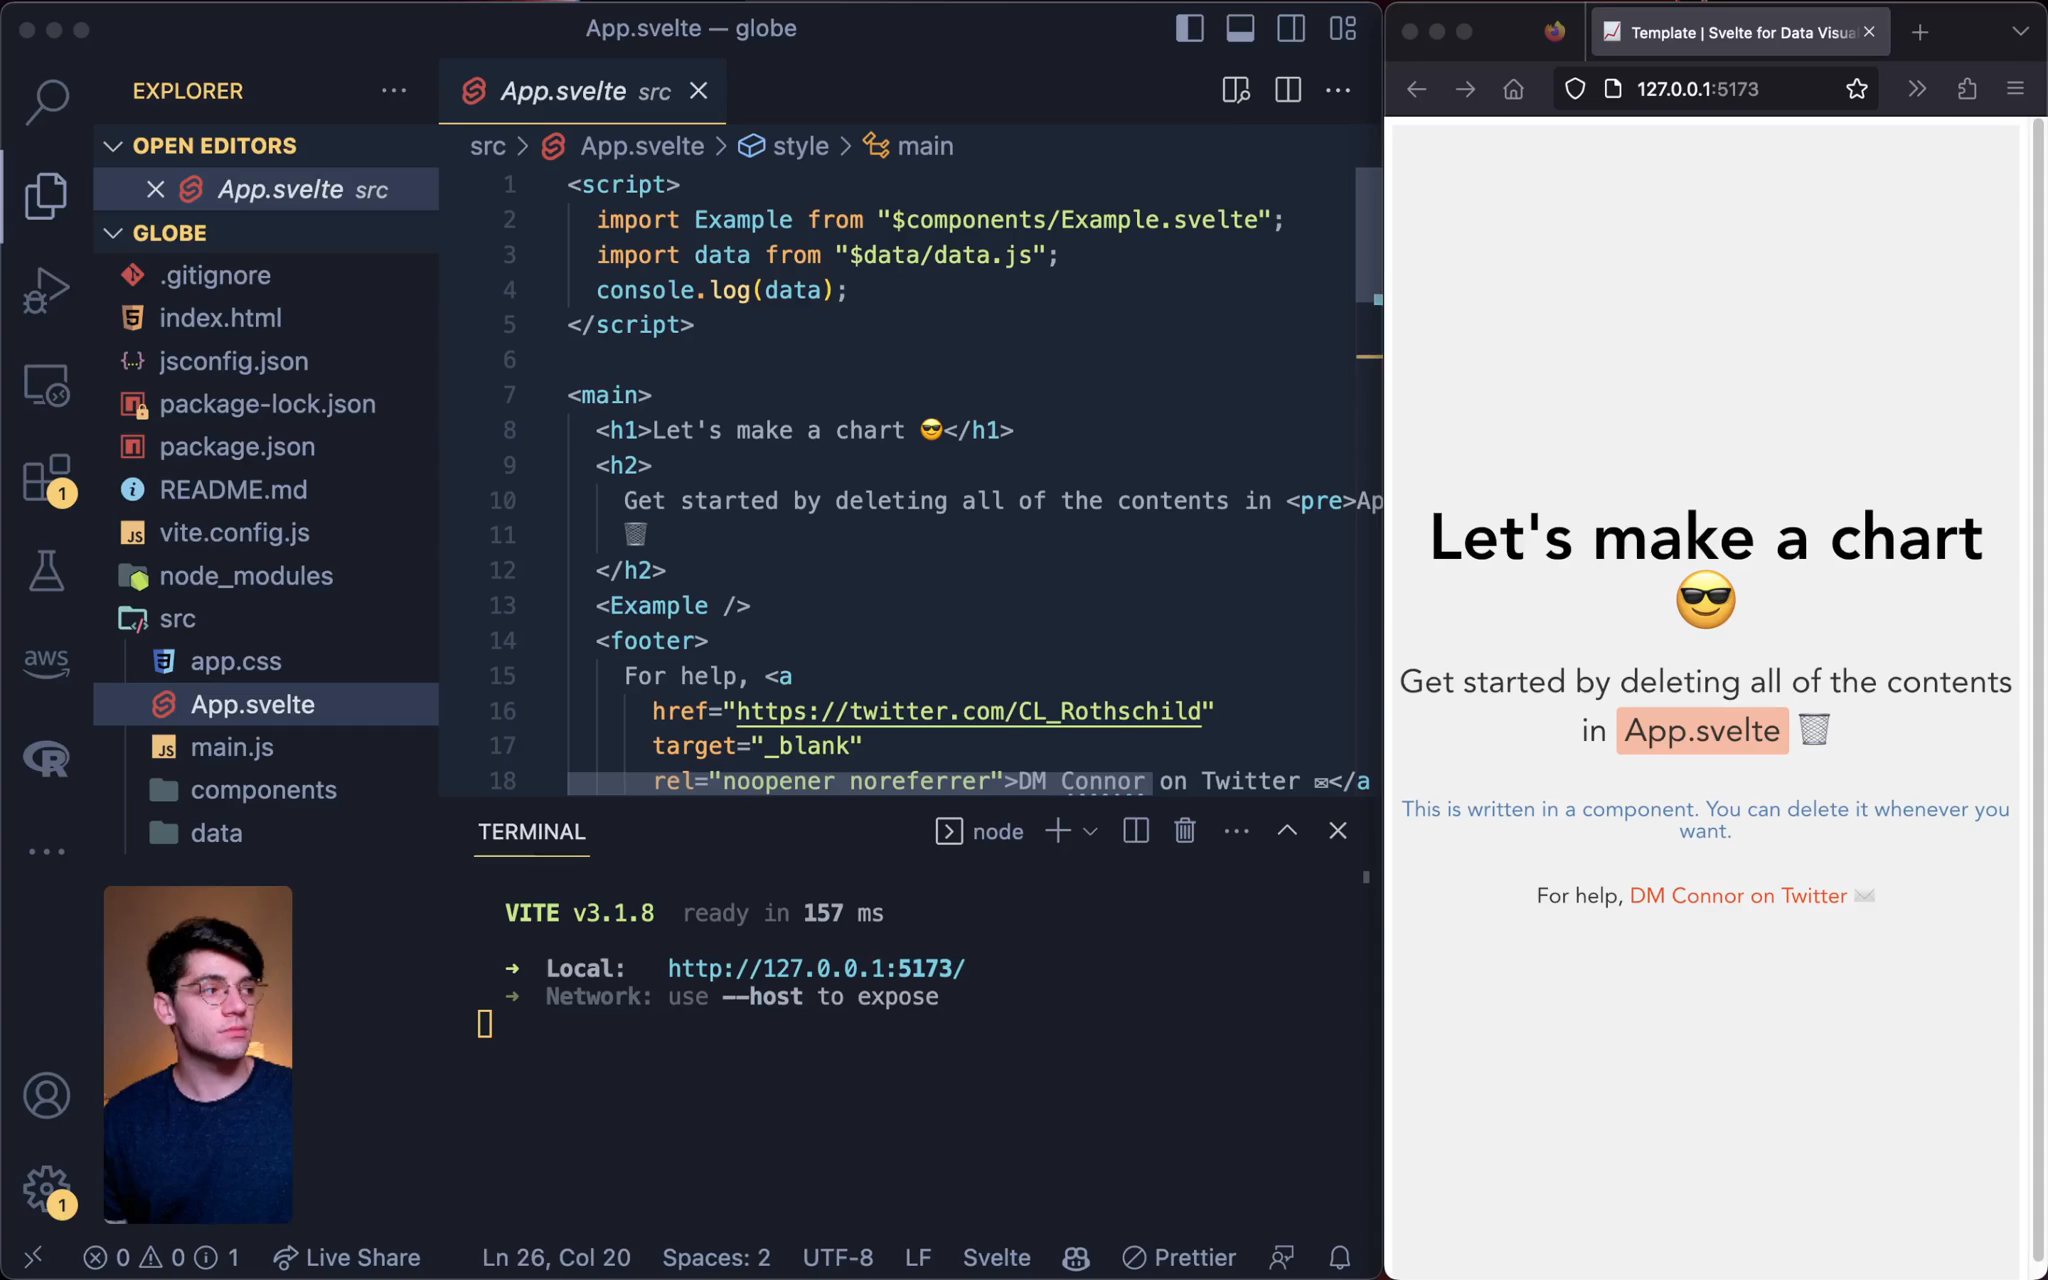
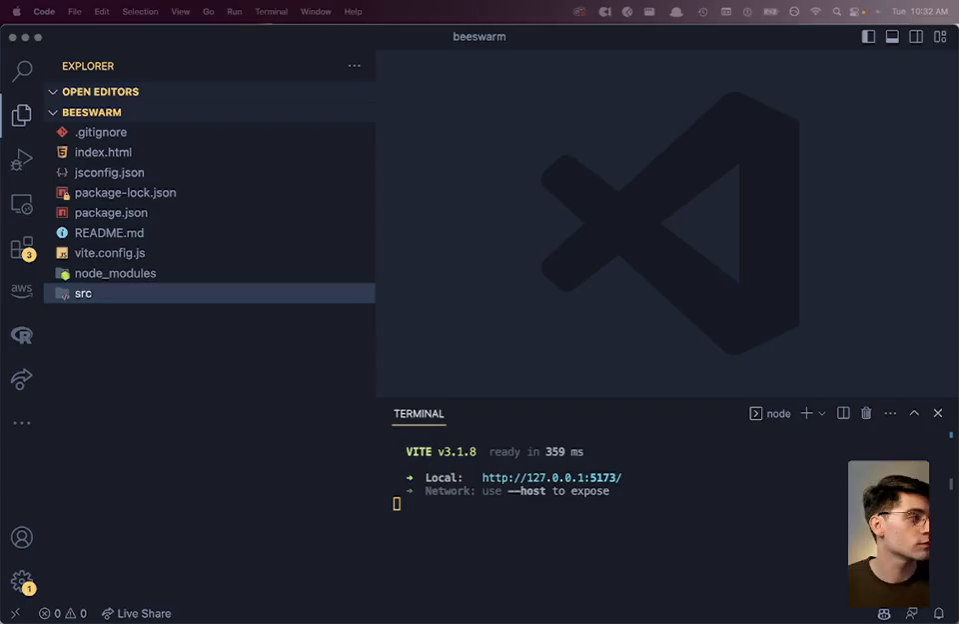
An Introduction to Beeswarm Charts with D3 and SvelteBuilding a Beeswarm Chart with Svelte and D3Beeswarm plots offer an elegant and interactive way to visualize distributions, outliers and patterns within datasets. In this lesson, we will cover the fundamentals of building a beeswarm plot, beginning with an in-depth explanation of force simulations in D3 data visualizations. Then, we will learn how to prepare data for a force layout via D3’s data manipulation methods (e.g., rollup), how to create a force layout with the d3-force module (to automatically position nodes, represented as circles, in clusters and avoid node collisions/overlap) and how to render nodes of the force layout in a responsive SVG canvas with Svelte.
lesson
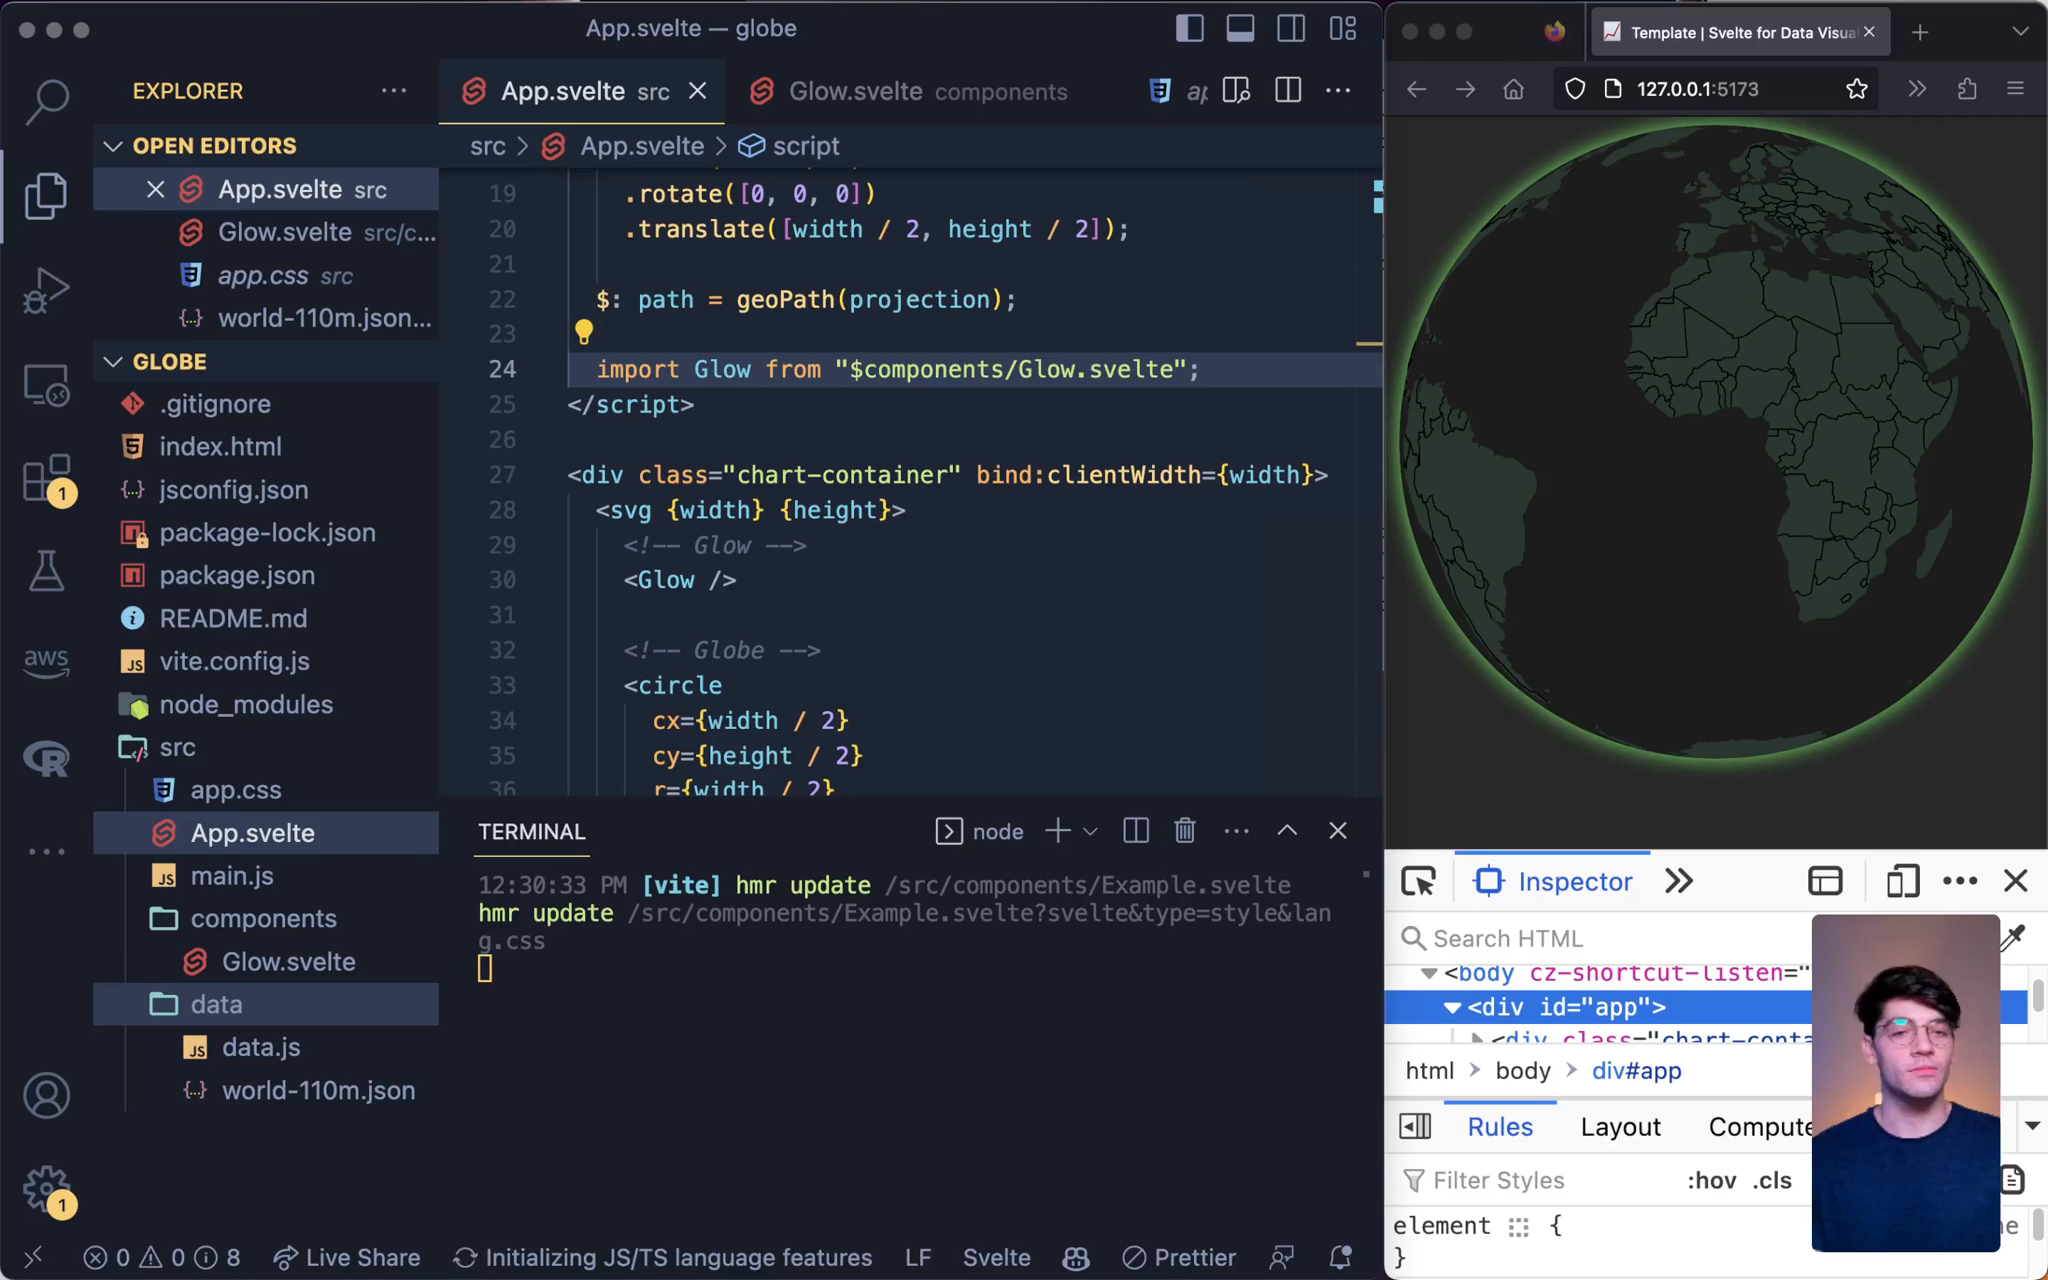
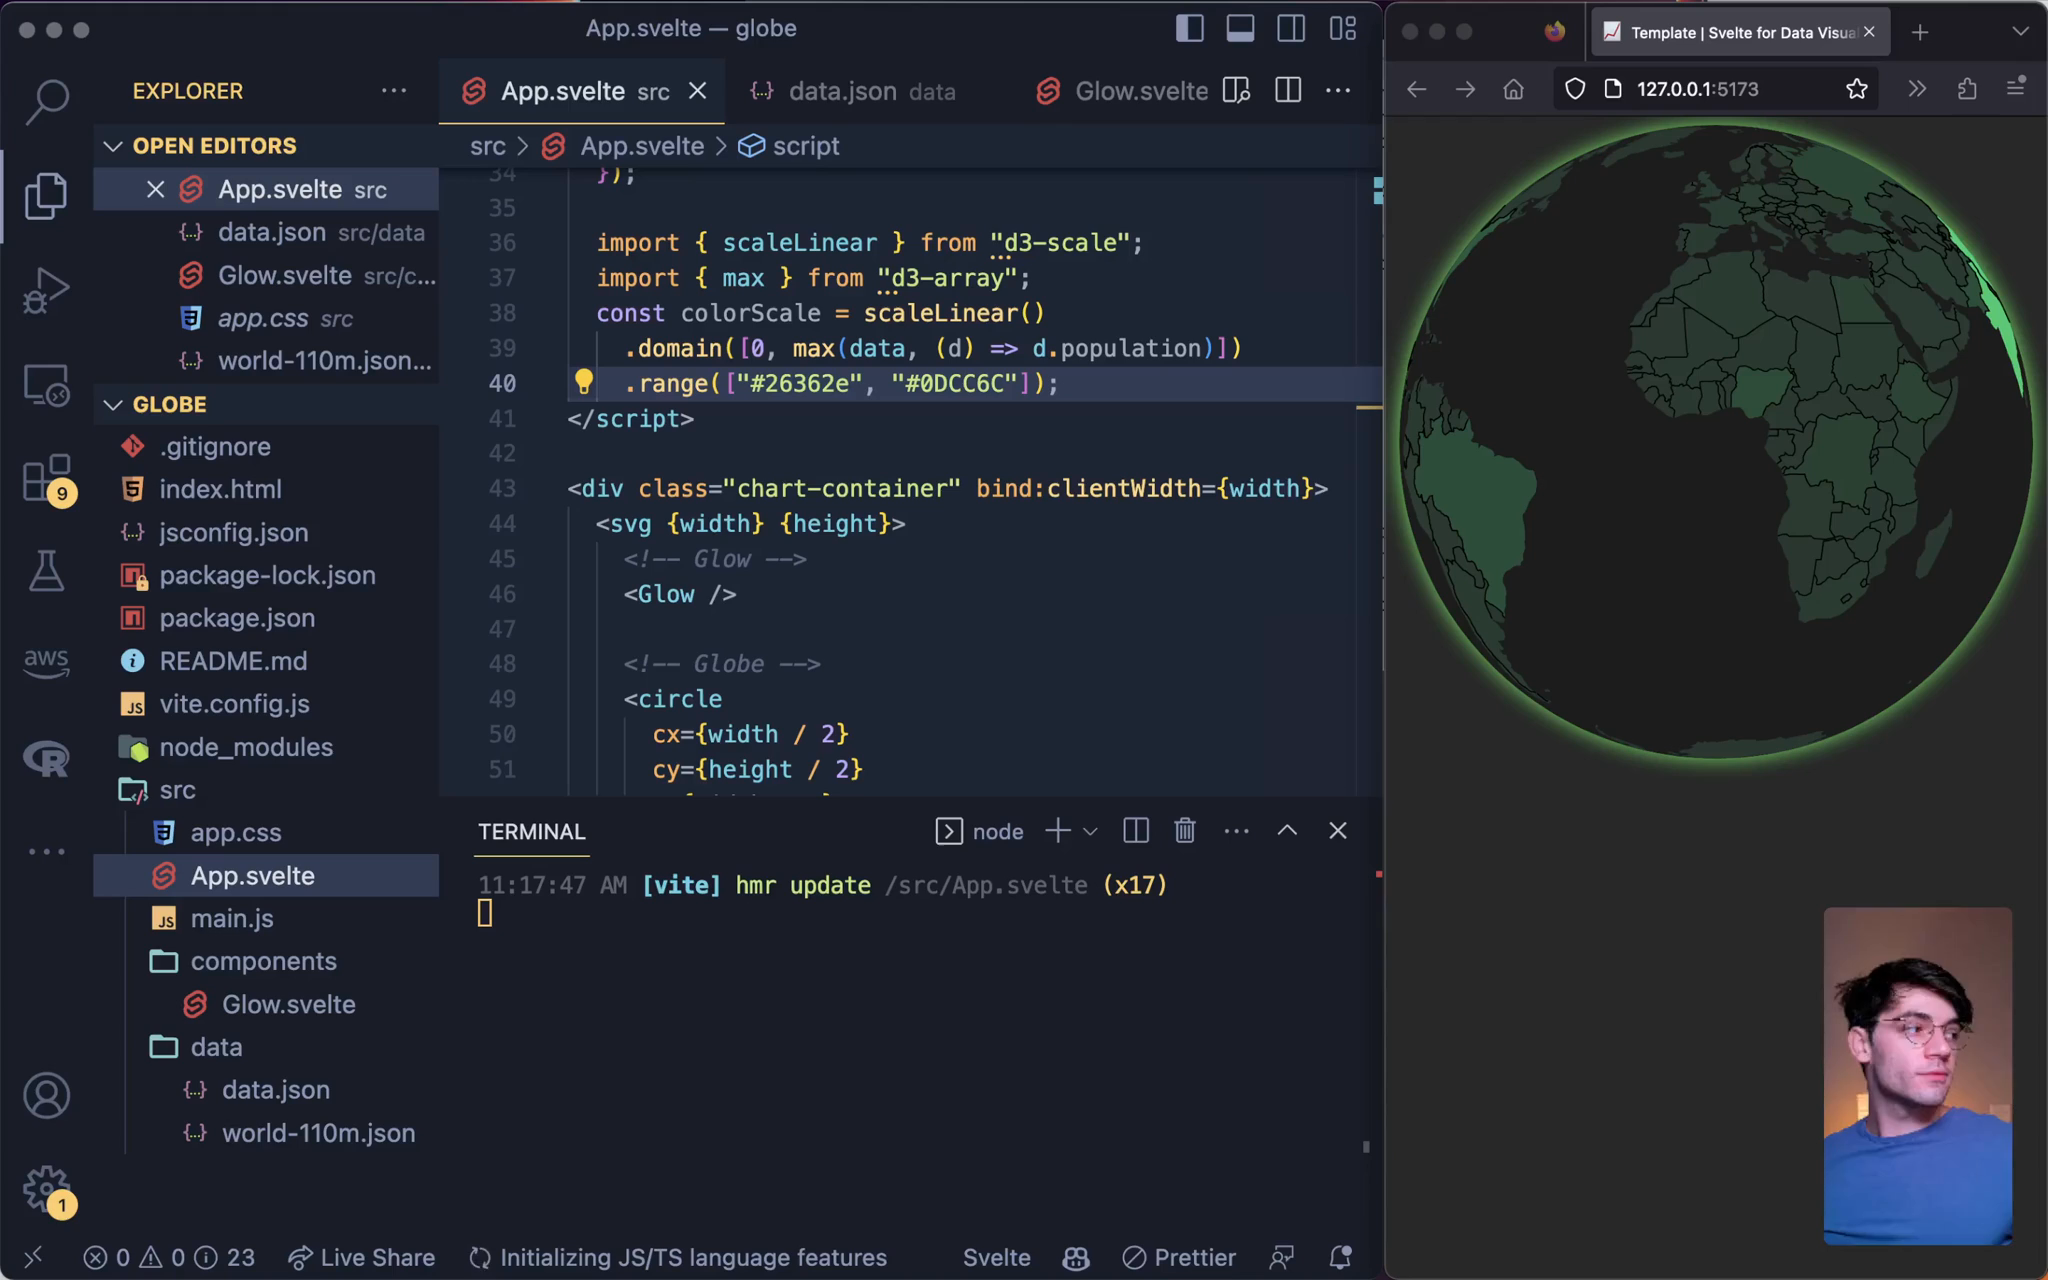
How to Add Data to a Svelte Globe VisualizationBetter Data Visualizations with SvelteMaking our countries' fill represent population
lesson
How to Clean Up and Componentize Svelte CodeBetter Data Visualizations with SvelteComponentizing our code for a more readable project
lesson
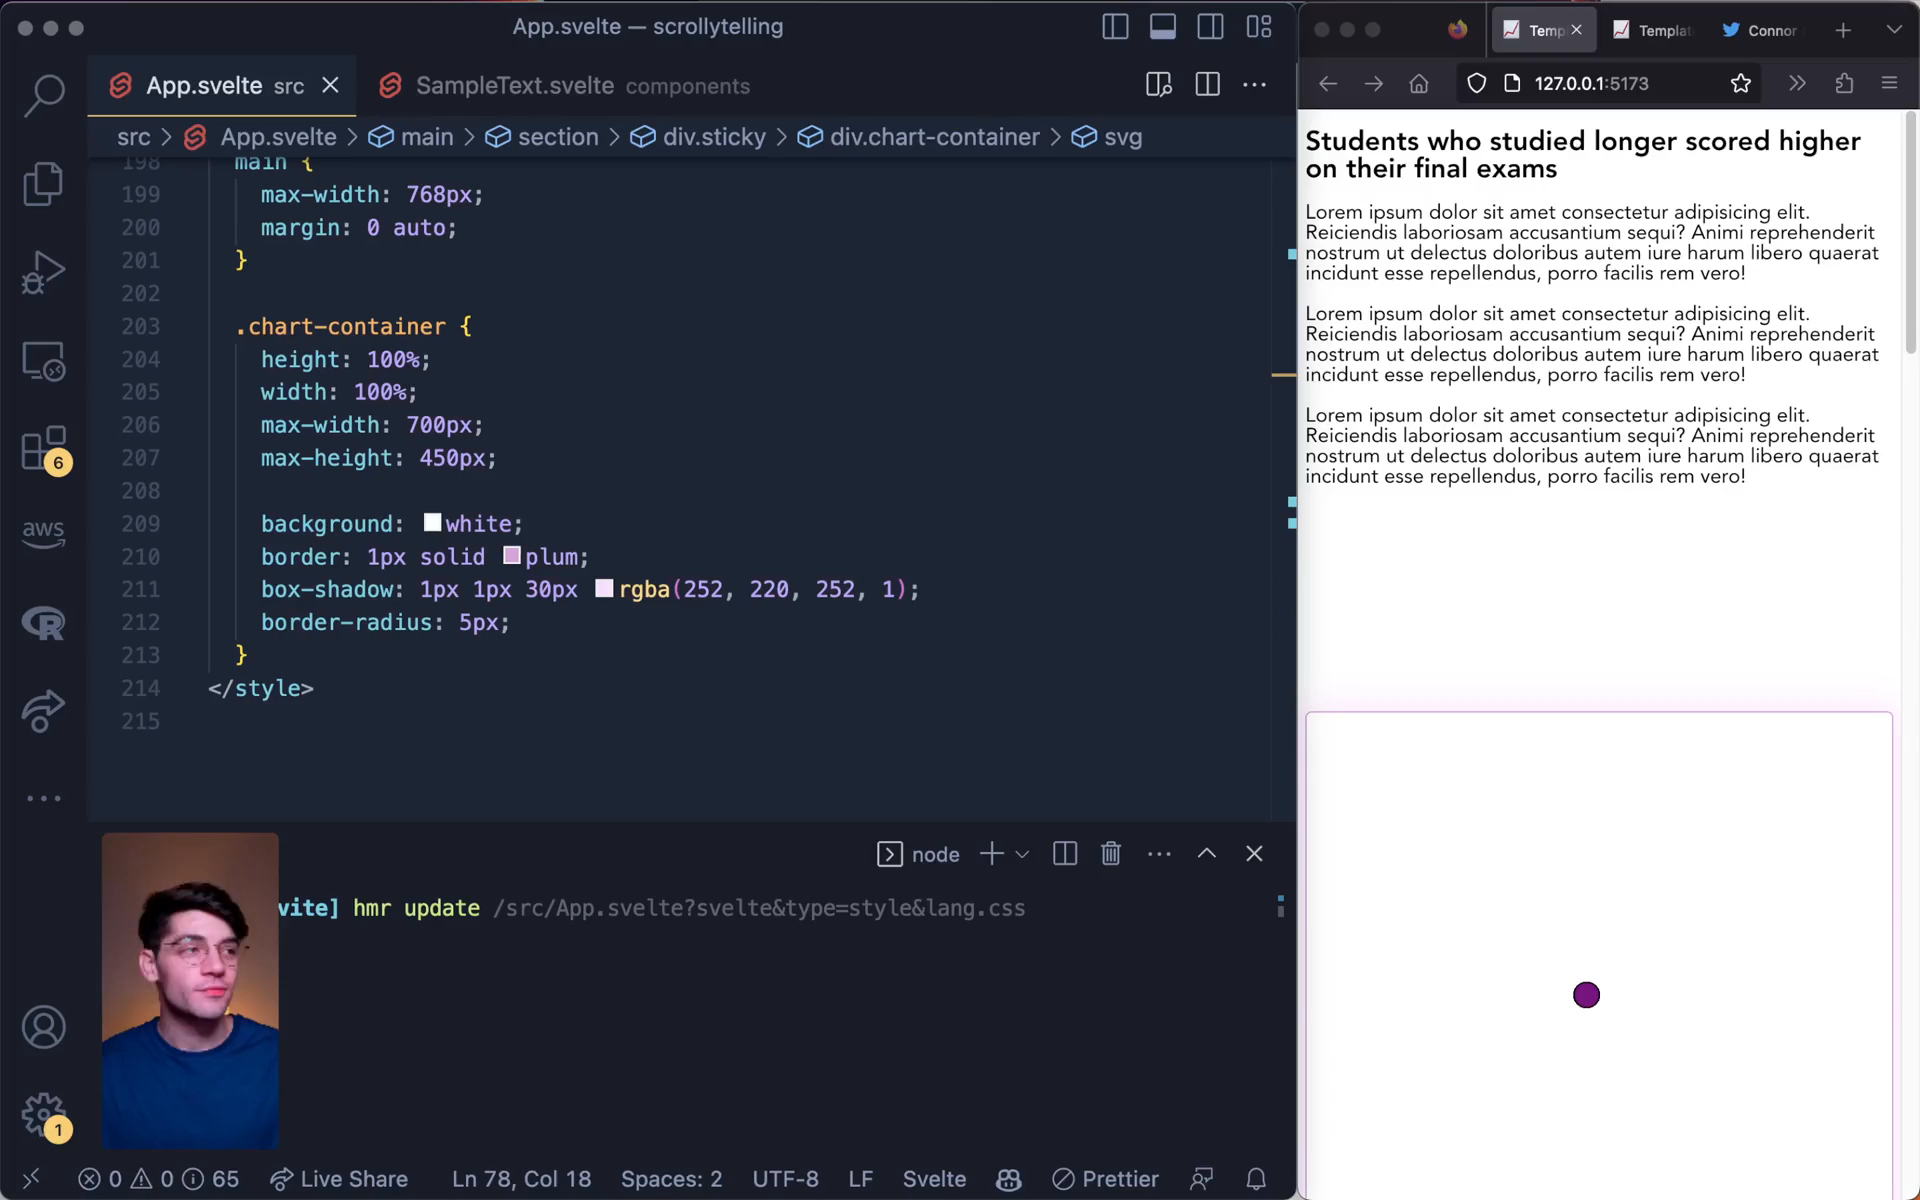
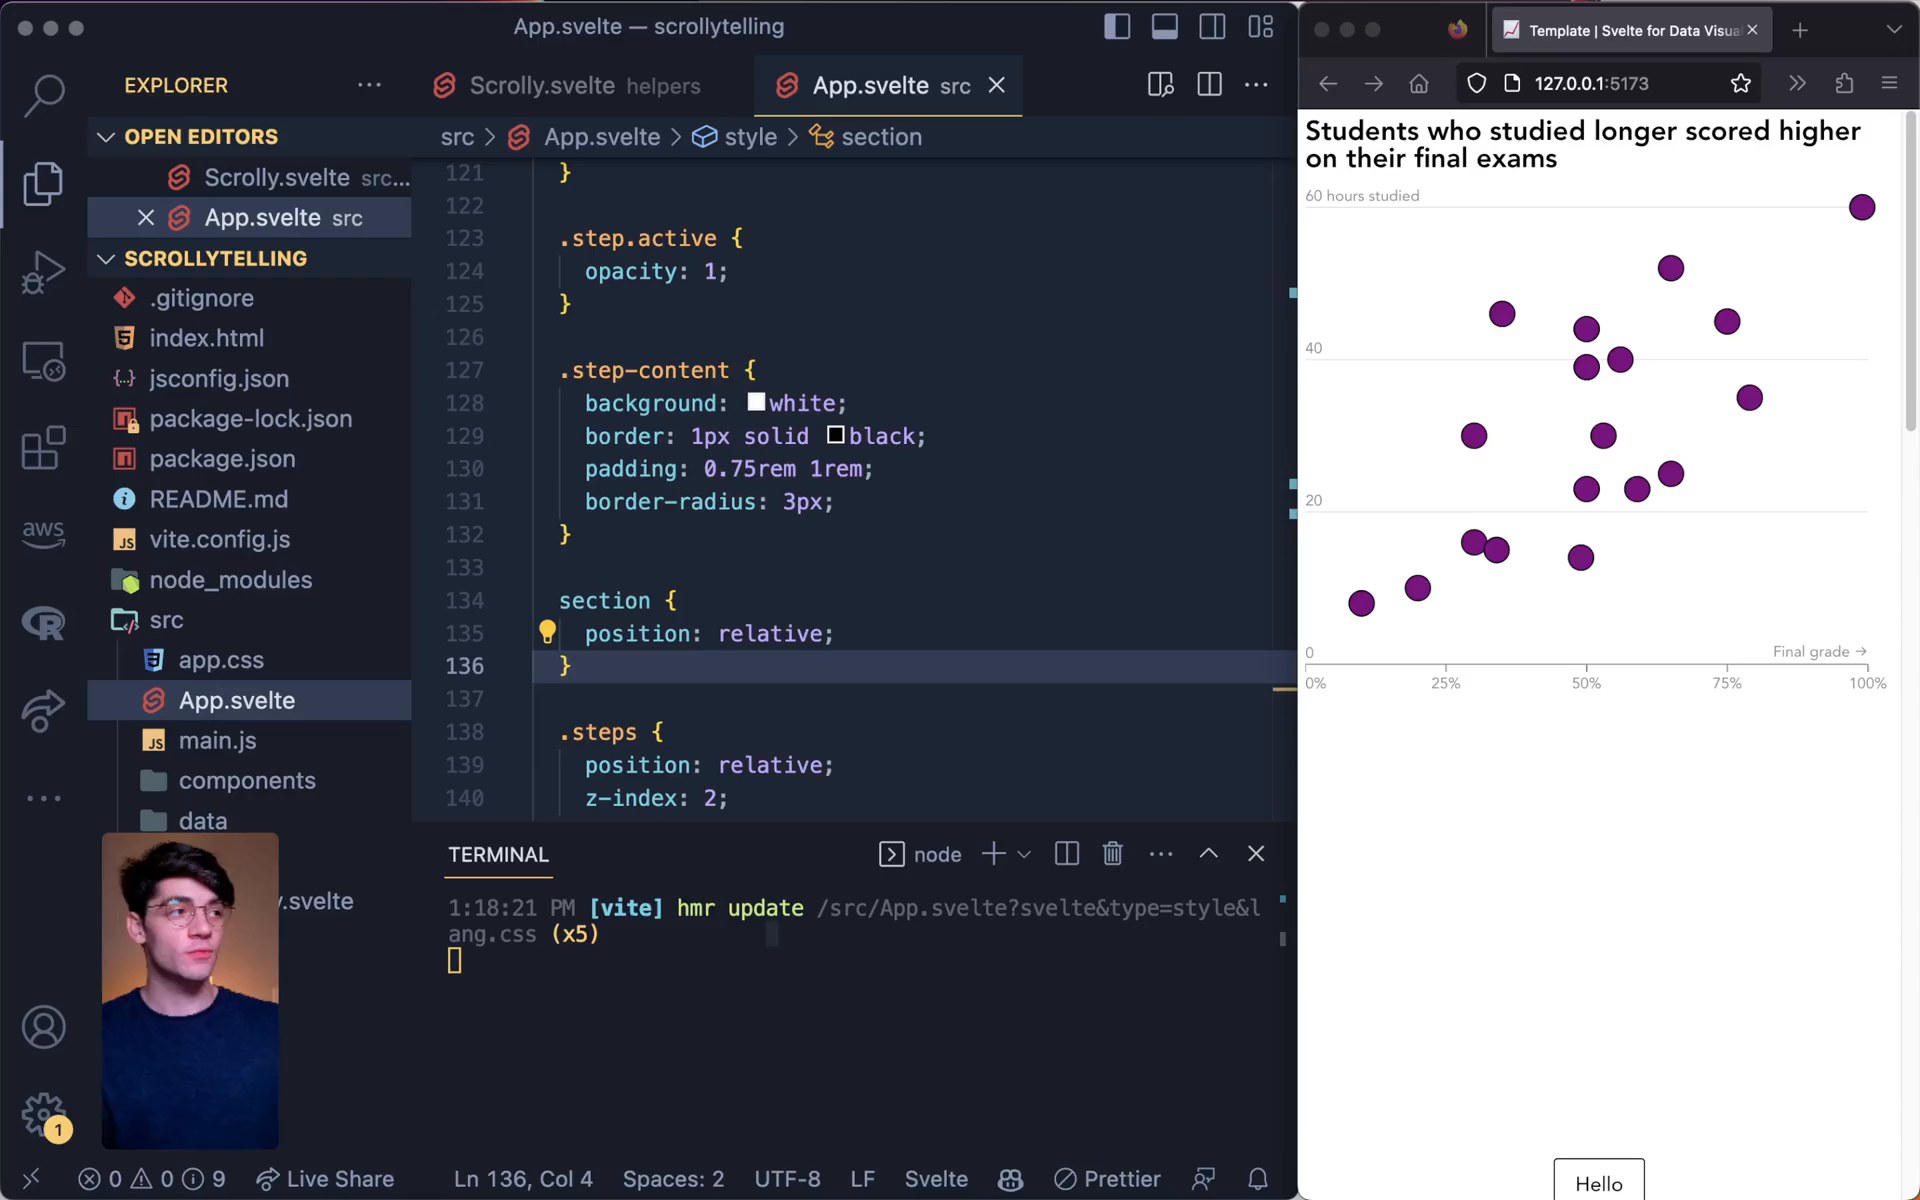
Adjusting Svelte Chart to Fit Within ArticlesBetter Data Visualizations with SvelteAdjusting our chart style so it fits nicely in an article
lesson
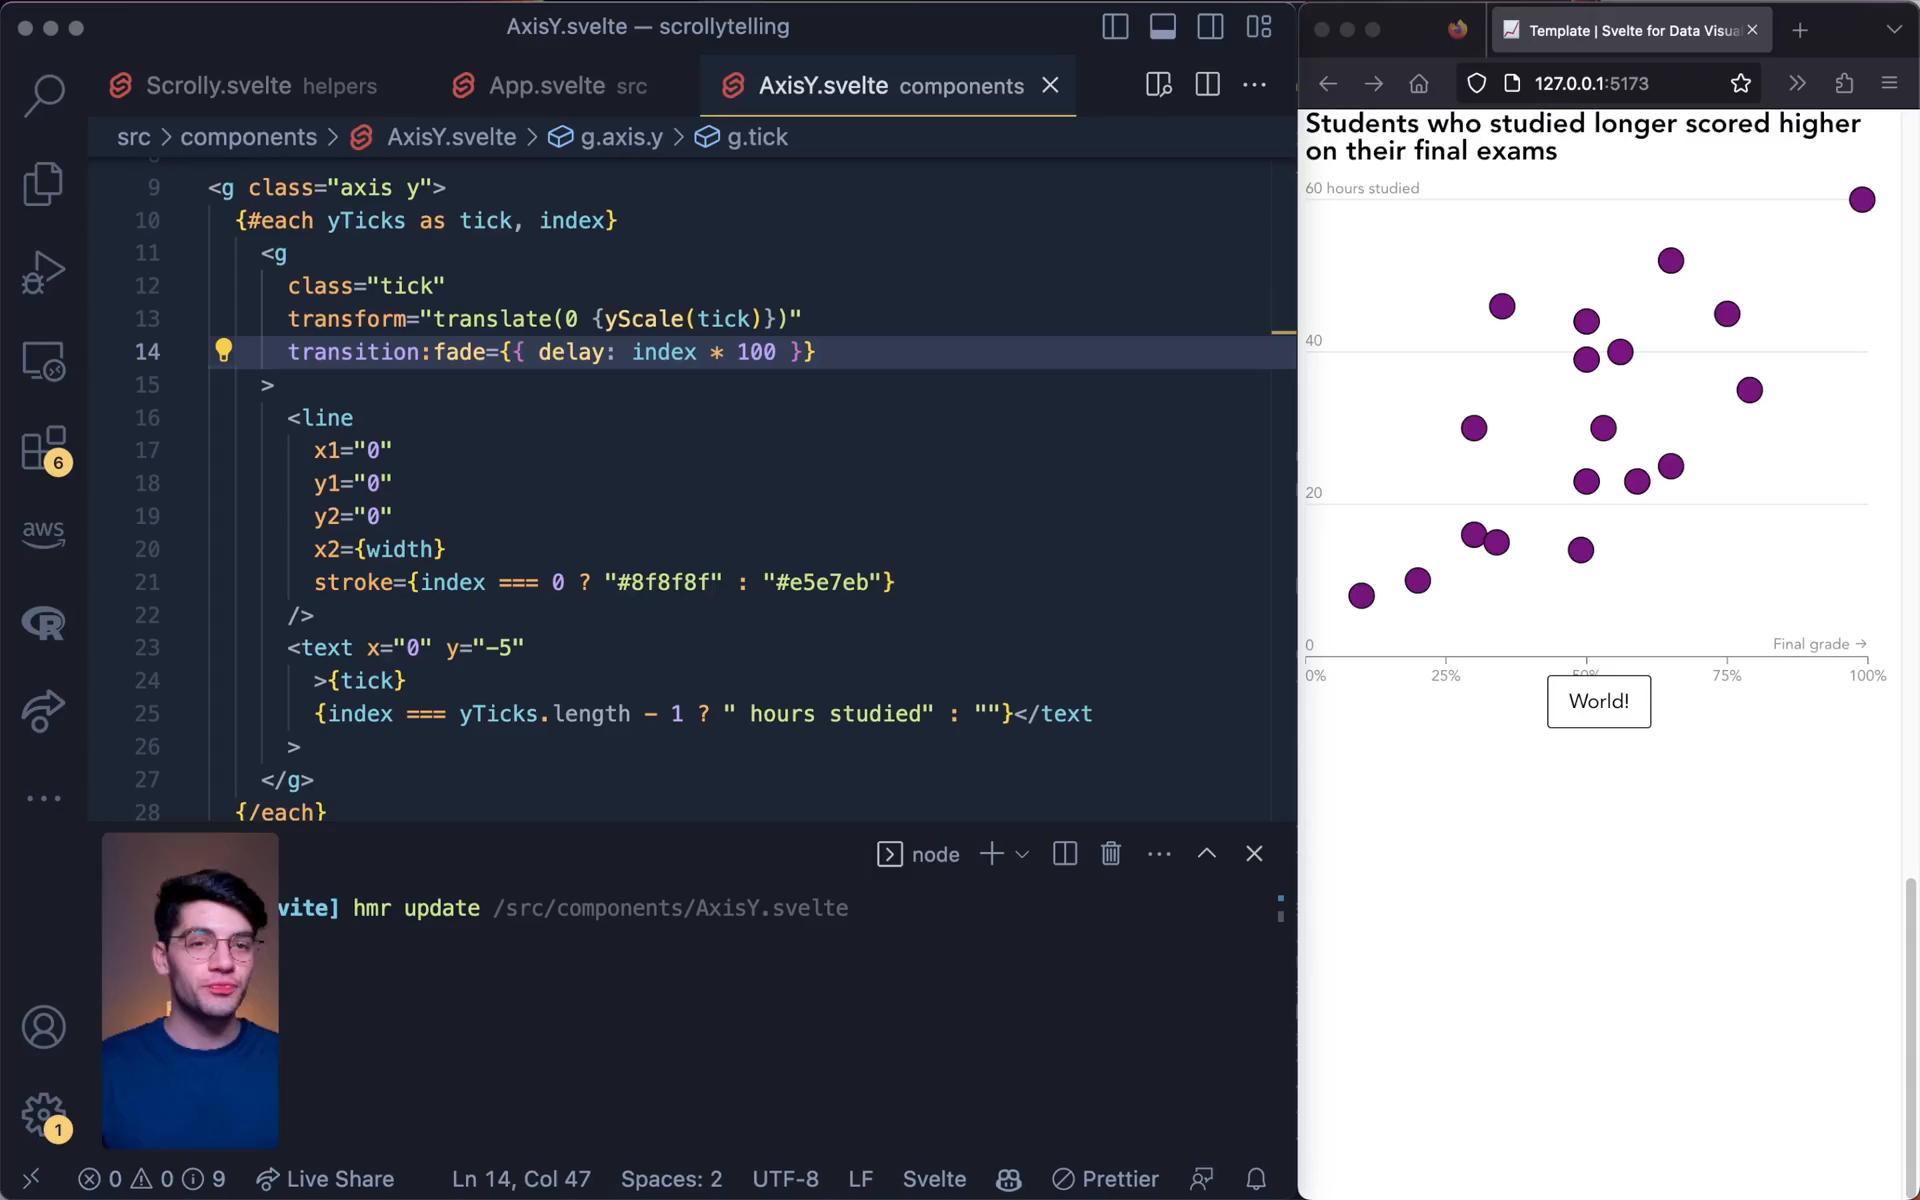
How to Update Axes Based On Scroll Position With ScrollytellingBetter Data Visualizations with SvelteUsing scroll position to update axes
lesson
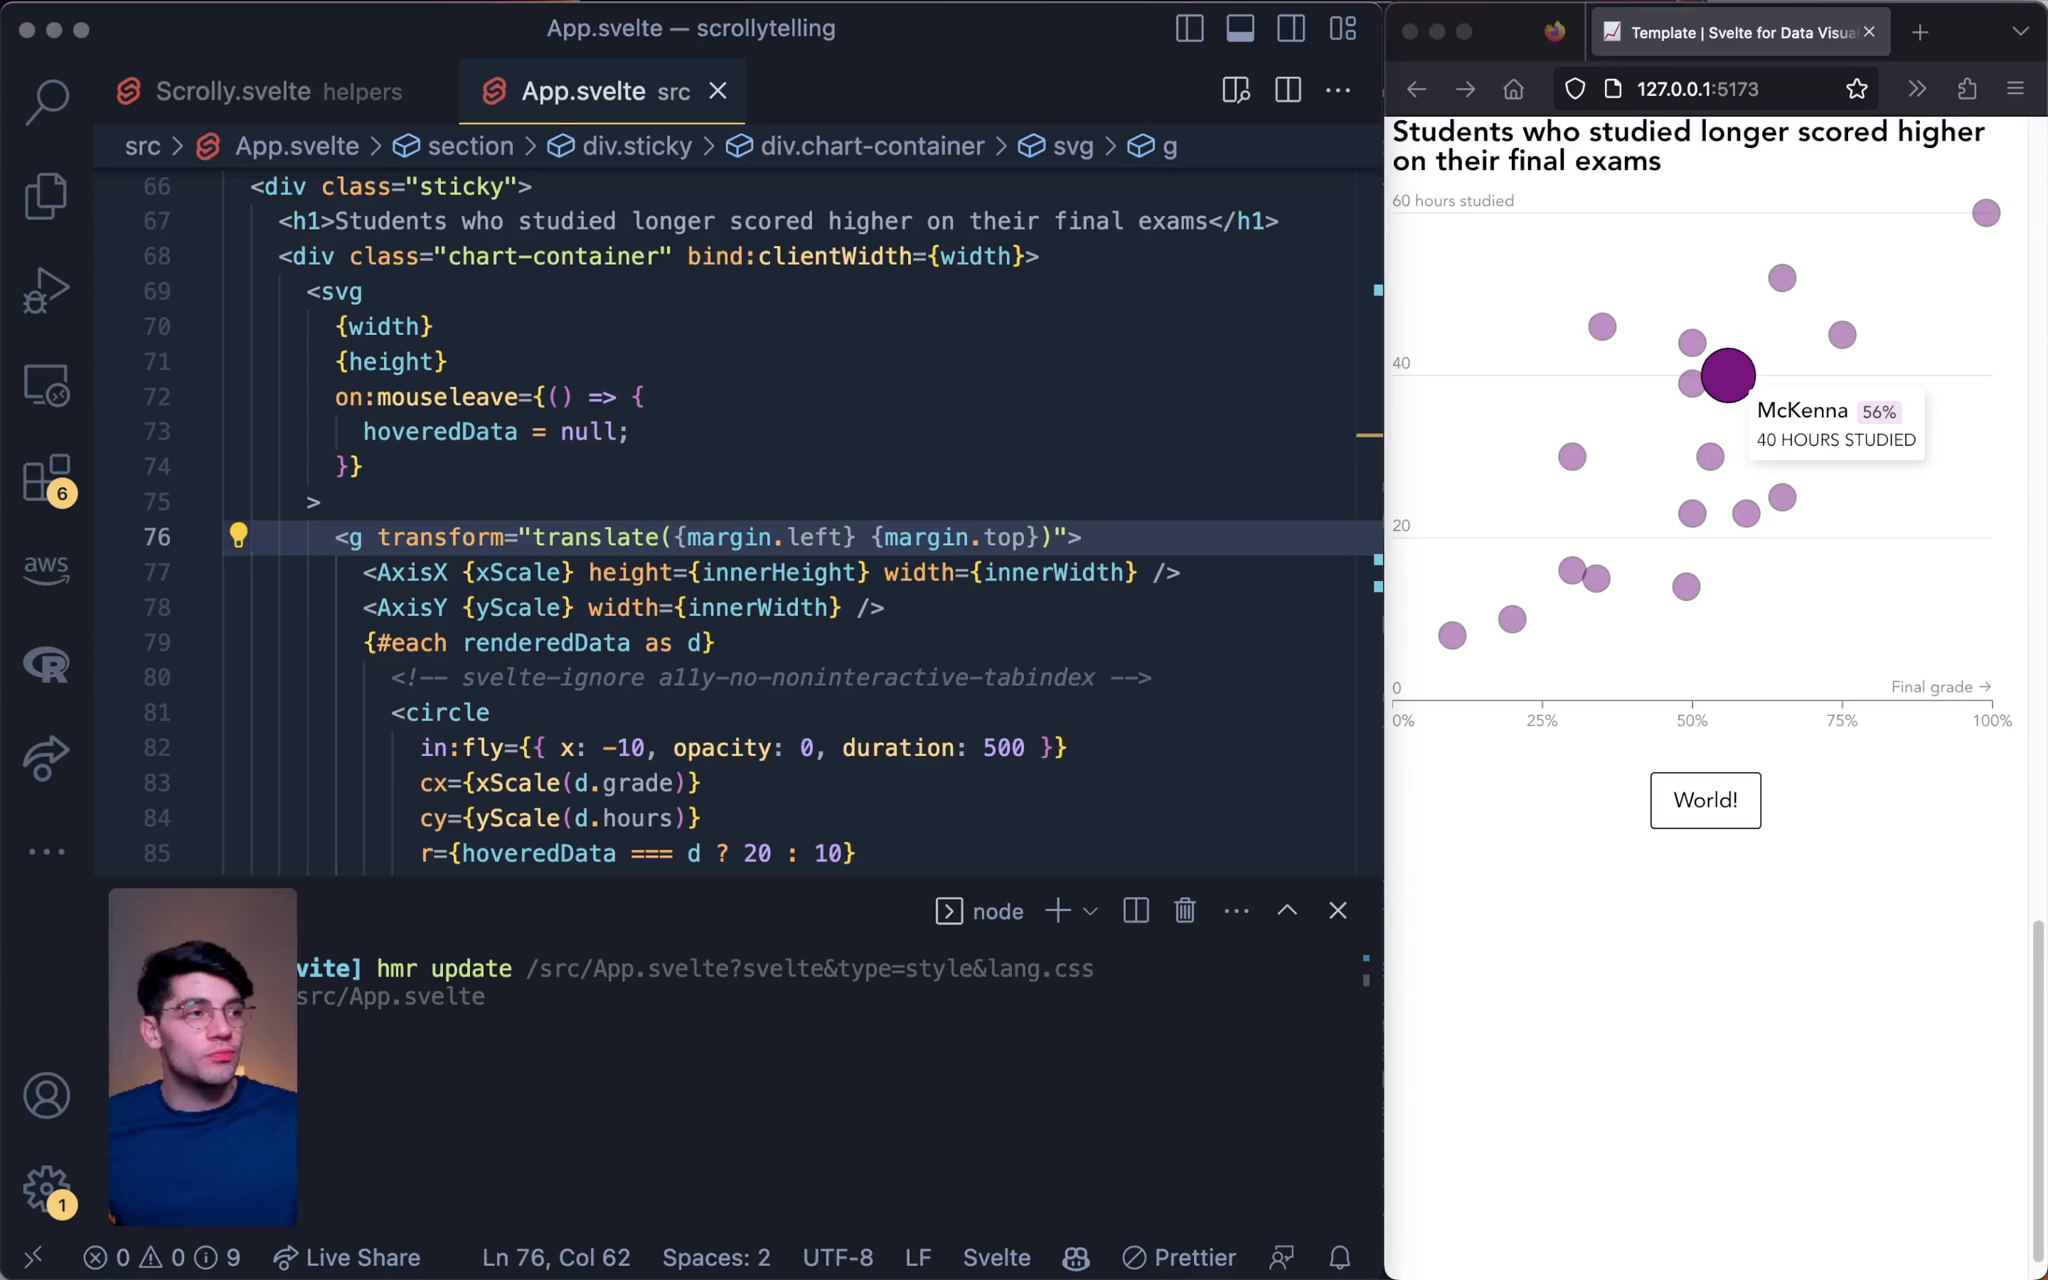
How to Trigger New Behavior on Scroll With ScrollytellingBetter Data Visualizations with SvelteUsing scroll position to trigger new behavior
lesson
An Introduction to the D3 Module d3-geo for Svelte ChartsBetter Data Visualizations with SvelteAn introduction to d3-geo
lesson
Adding Dynamic, Data-Based Styling to a Svelte Beeswarm PlotBetter Data Visualizations with SvelteAdding dynamic, data-based styling to our beeswarm chart
lesson
An introduction to d3-force for Svelte VisualizationsBetter Data Visualizations with SvelteAn introduction to `d3-force`