Lessons
view all ⭢lesson
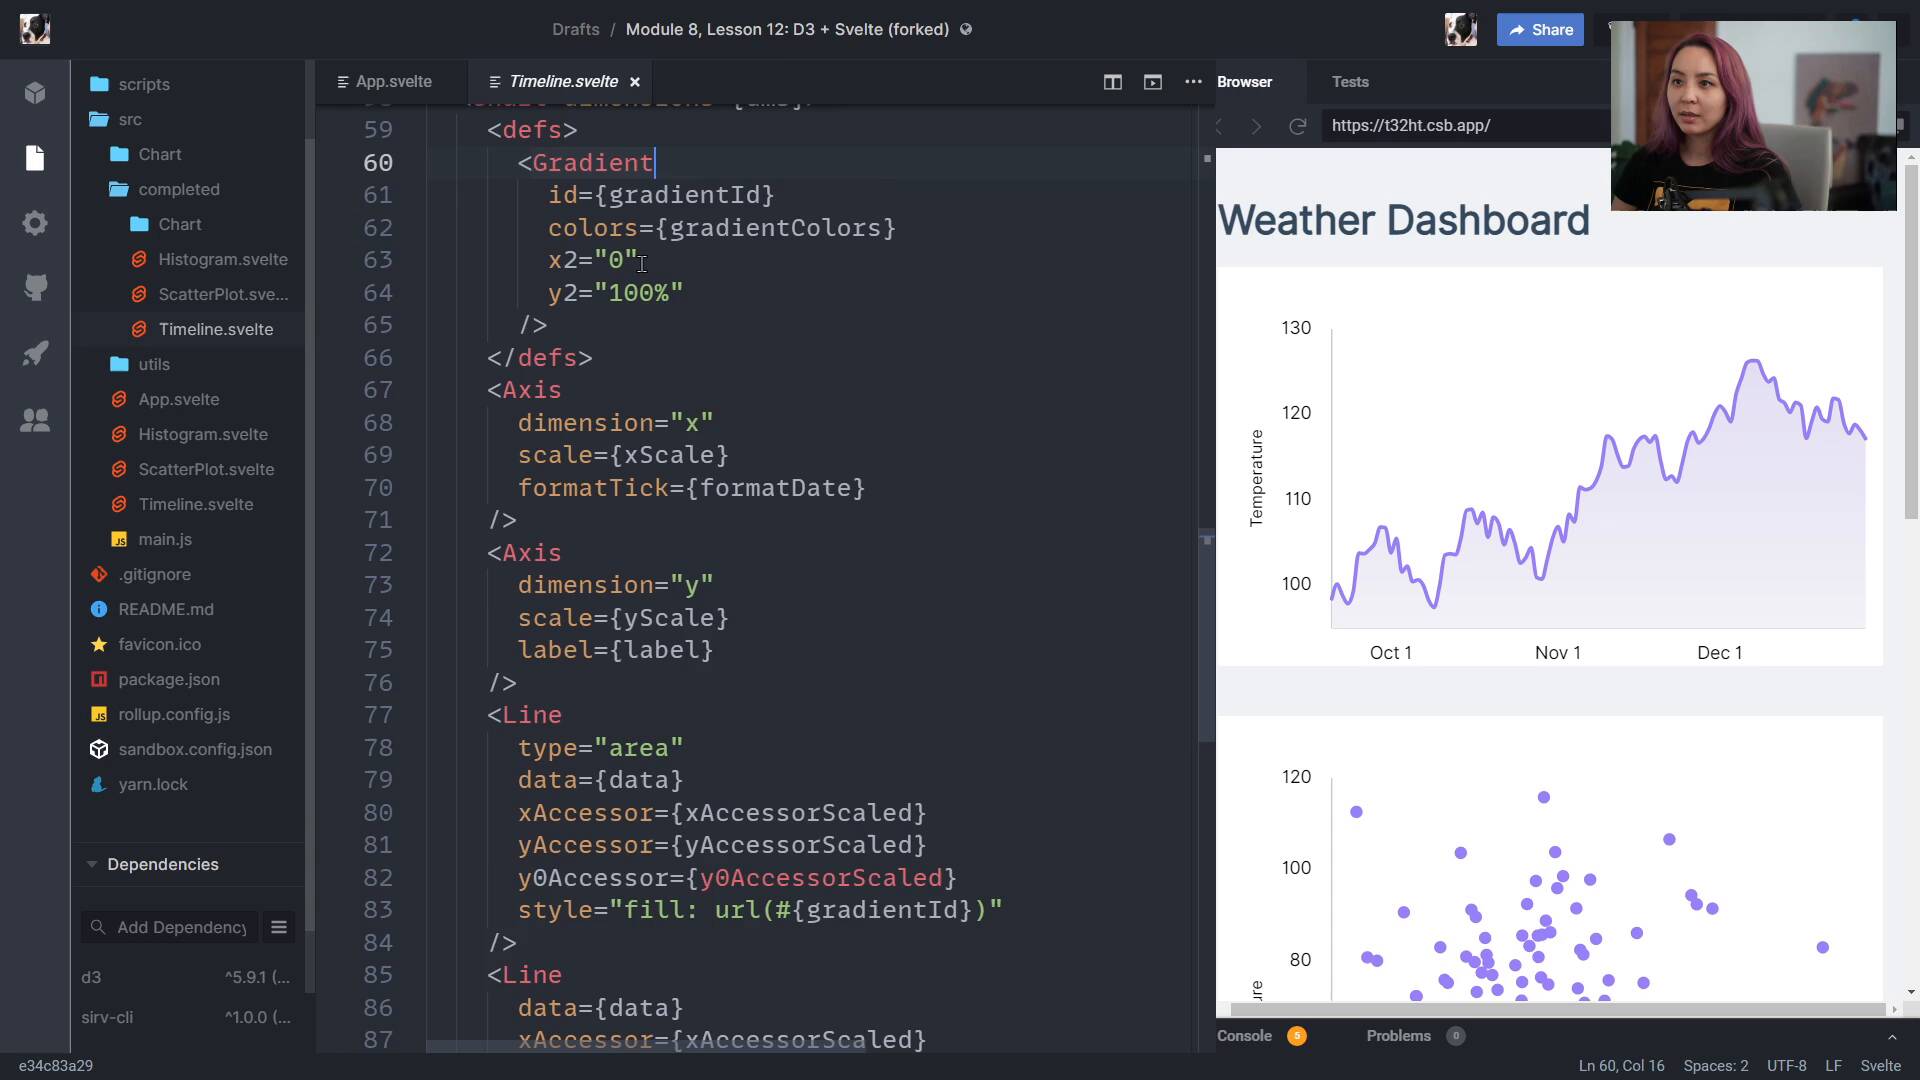
Using d3 with Svelte.jsFullstack D3 MasterclassWe take a look at how to combine d3 + Svelte.js, with a complete codebase.
lesson
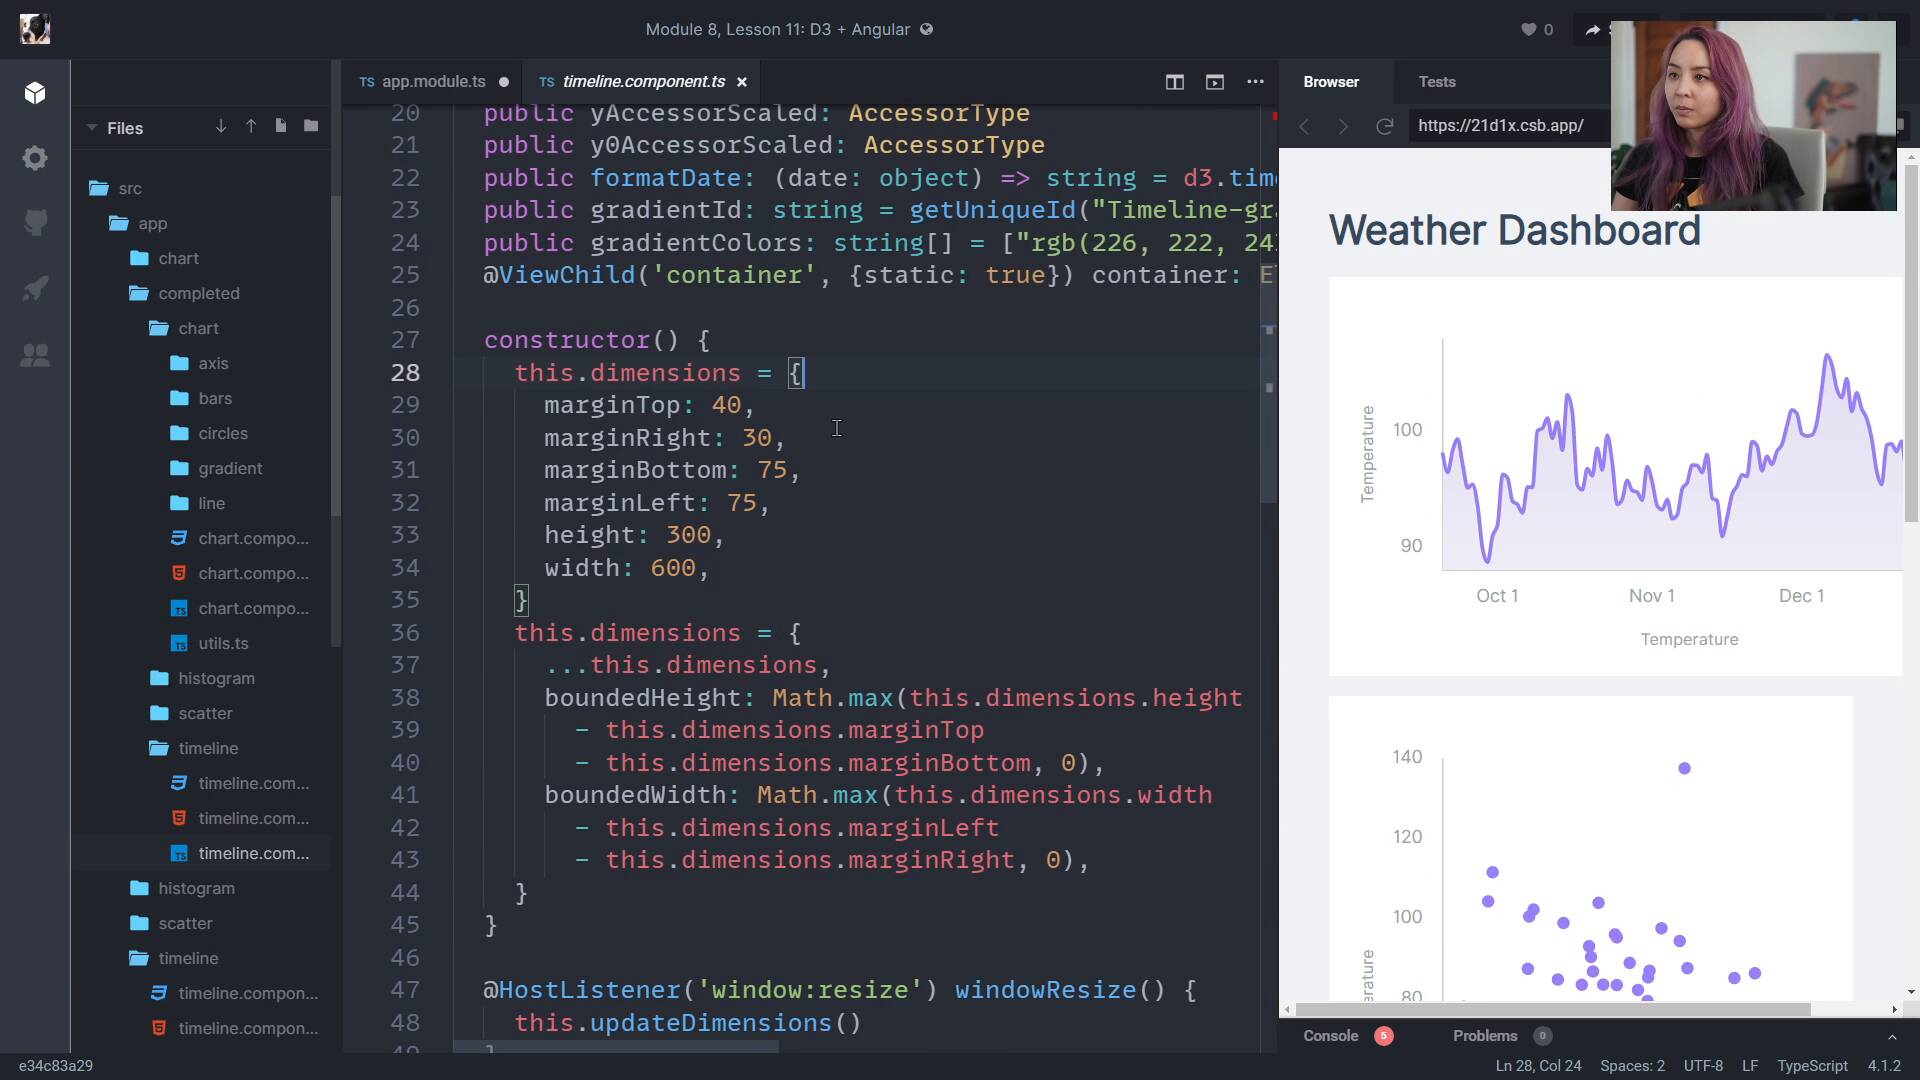
Using d3 with Angular.jsFullstack D3 MasterclassWe take a look at how to combine d3 + Angular, with a complete codebase.
lesson
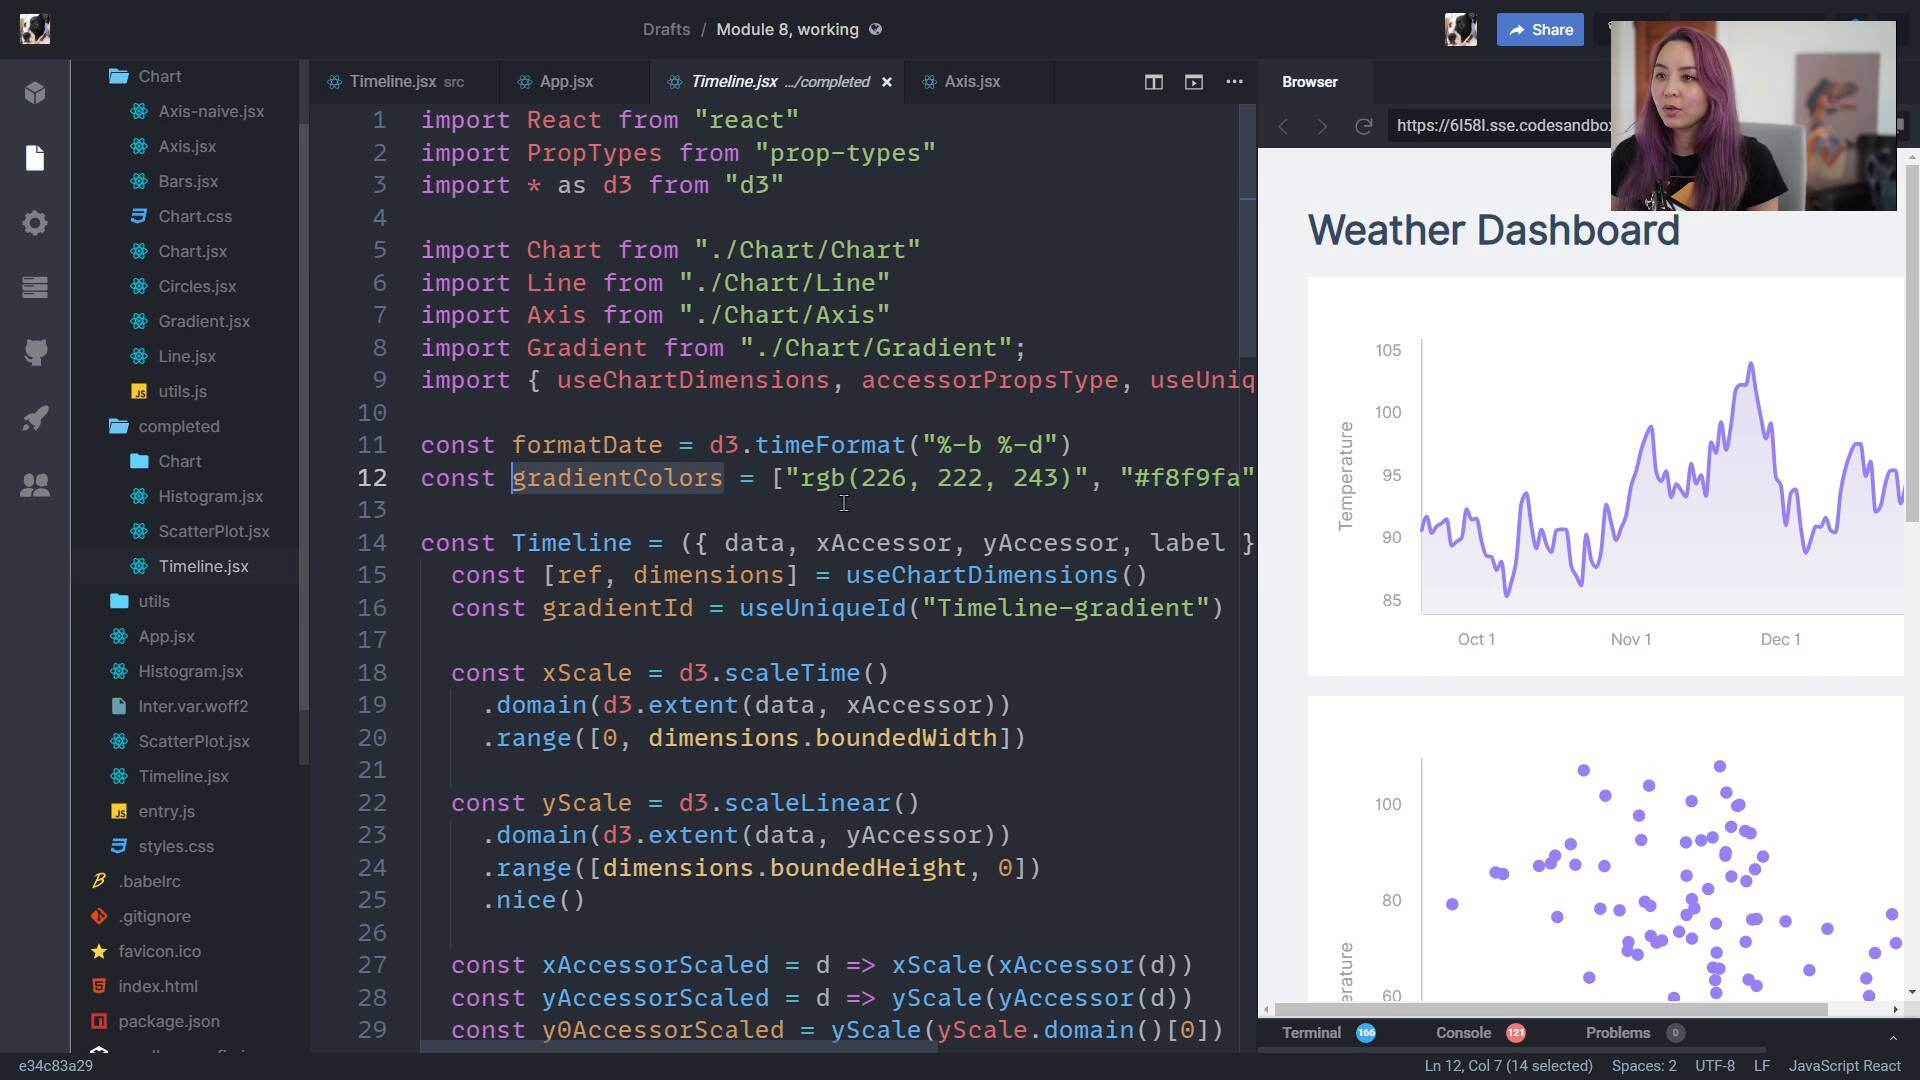
Setting up interactions in React, and wrapping upFullstack D3 MasterclassWe wrap up by talking about how to add interactions and look at the completed code for a Timeline, Scatter plot, and Histogram.
lesson
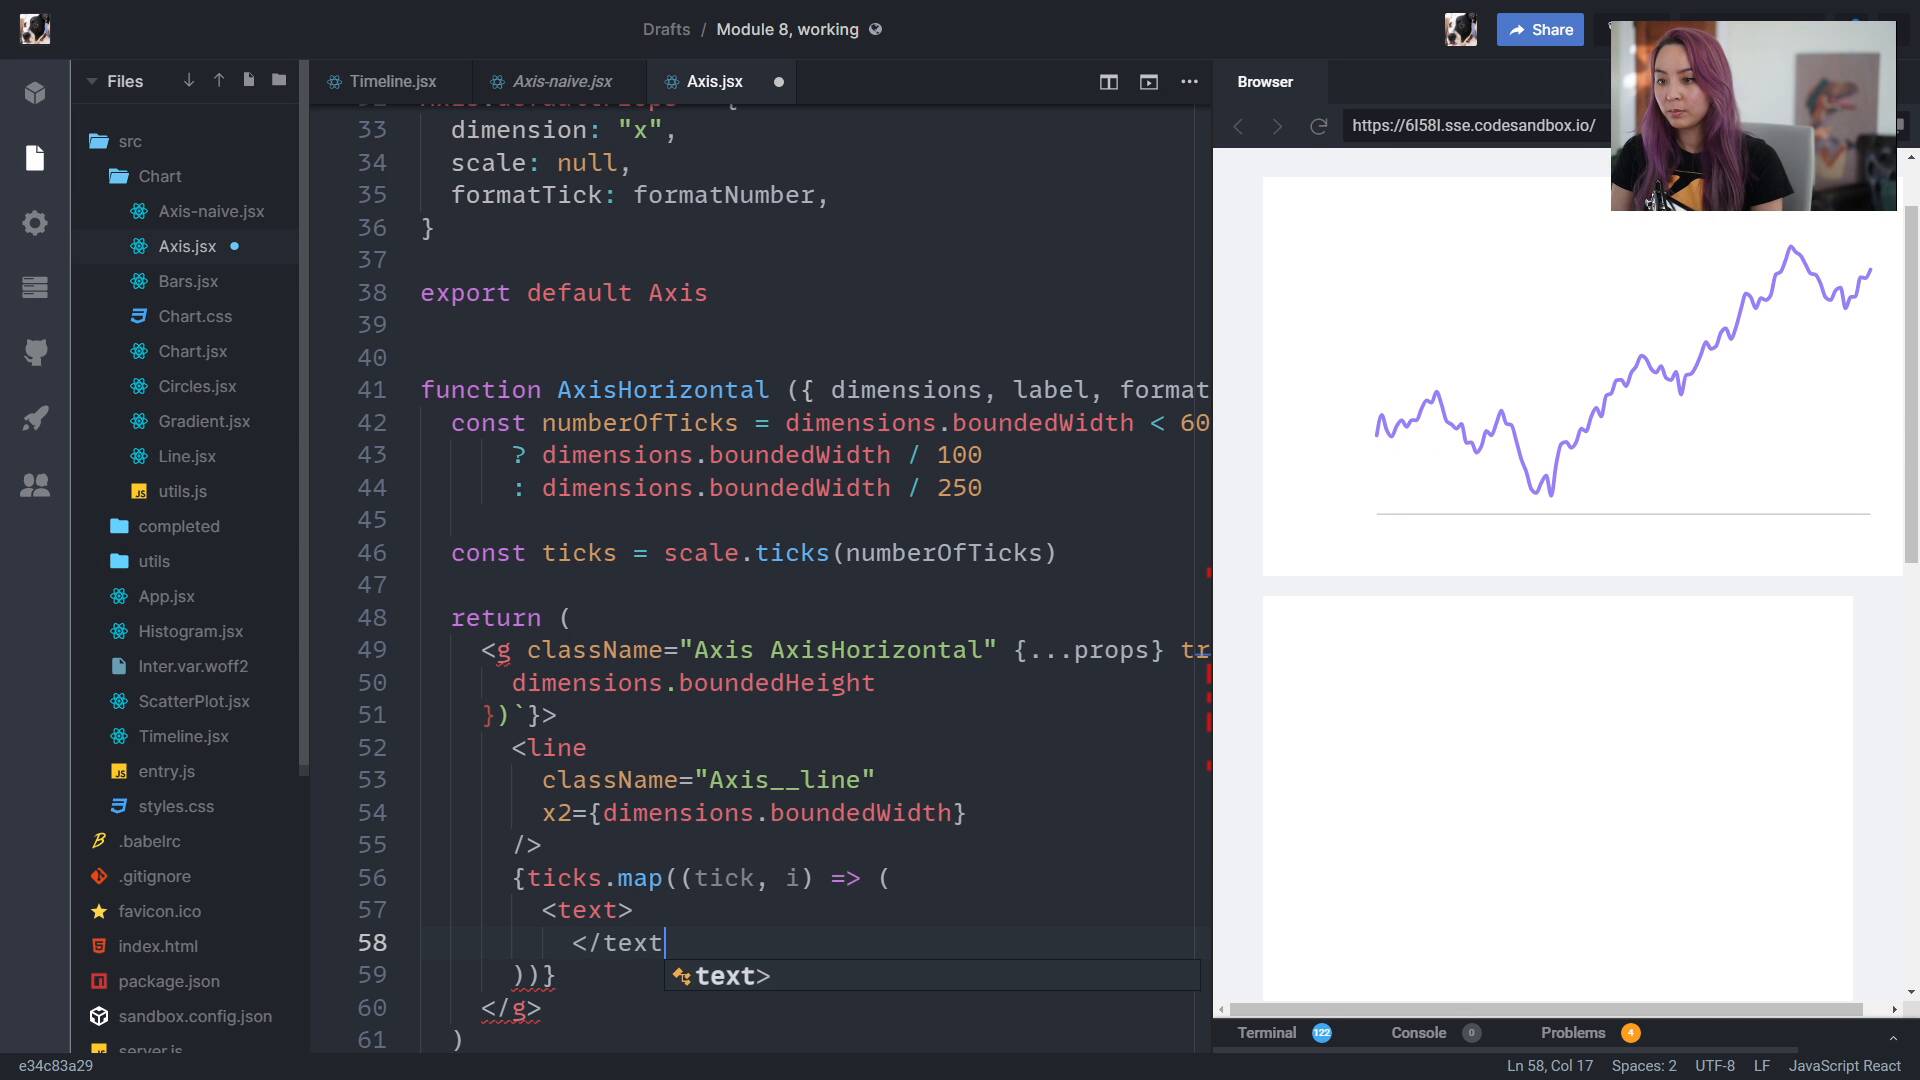
Drawing our peripherals in React, take twoFullstack D3 MasterclassWe learn an alternate, less hacky solution for creating an Axis component that lets React do all of the rendering.
lesson
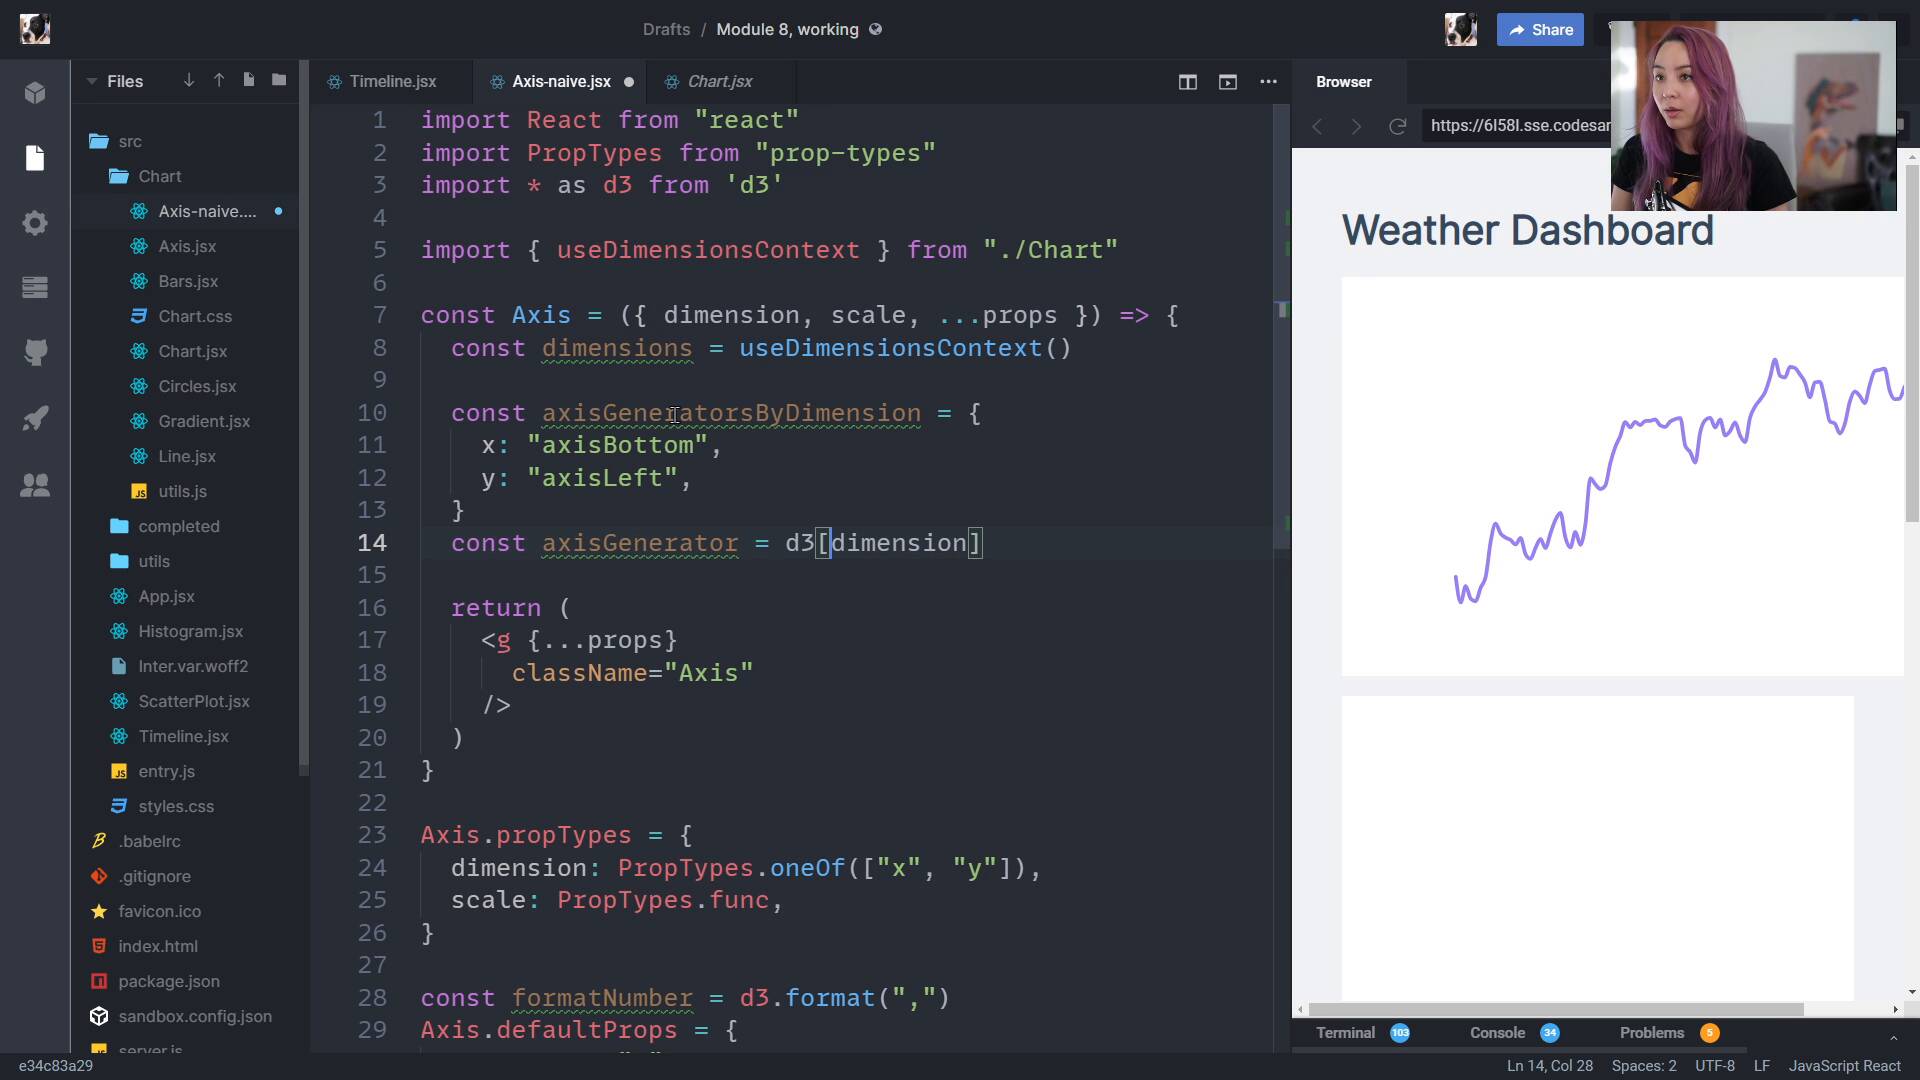
Drawing our peripherals in ReactFullstack D3 MasterclassWe take a naive approach to creating an Axis component
lesson
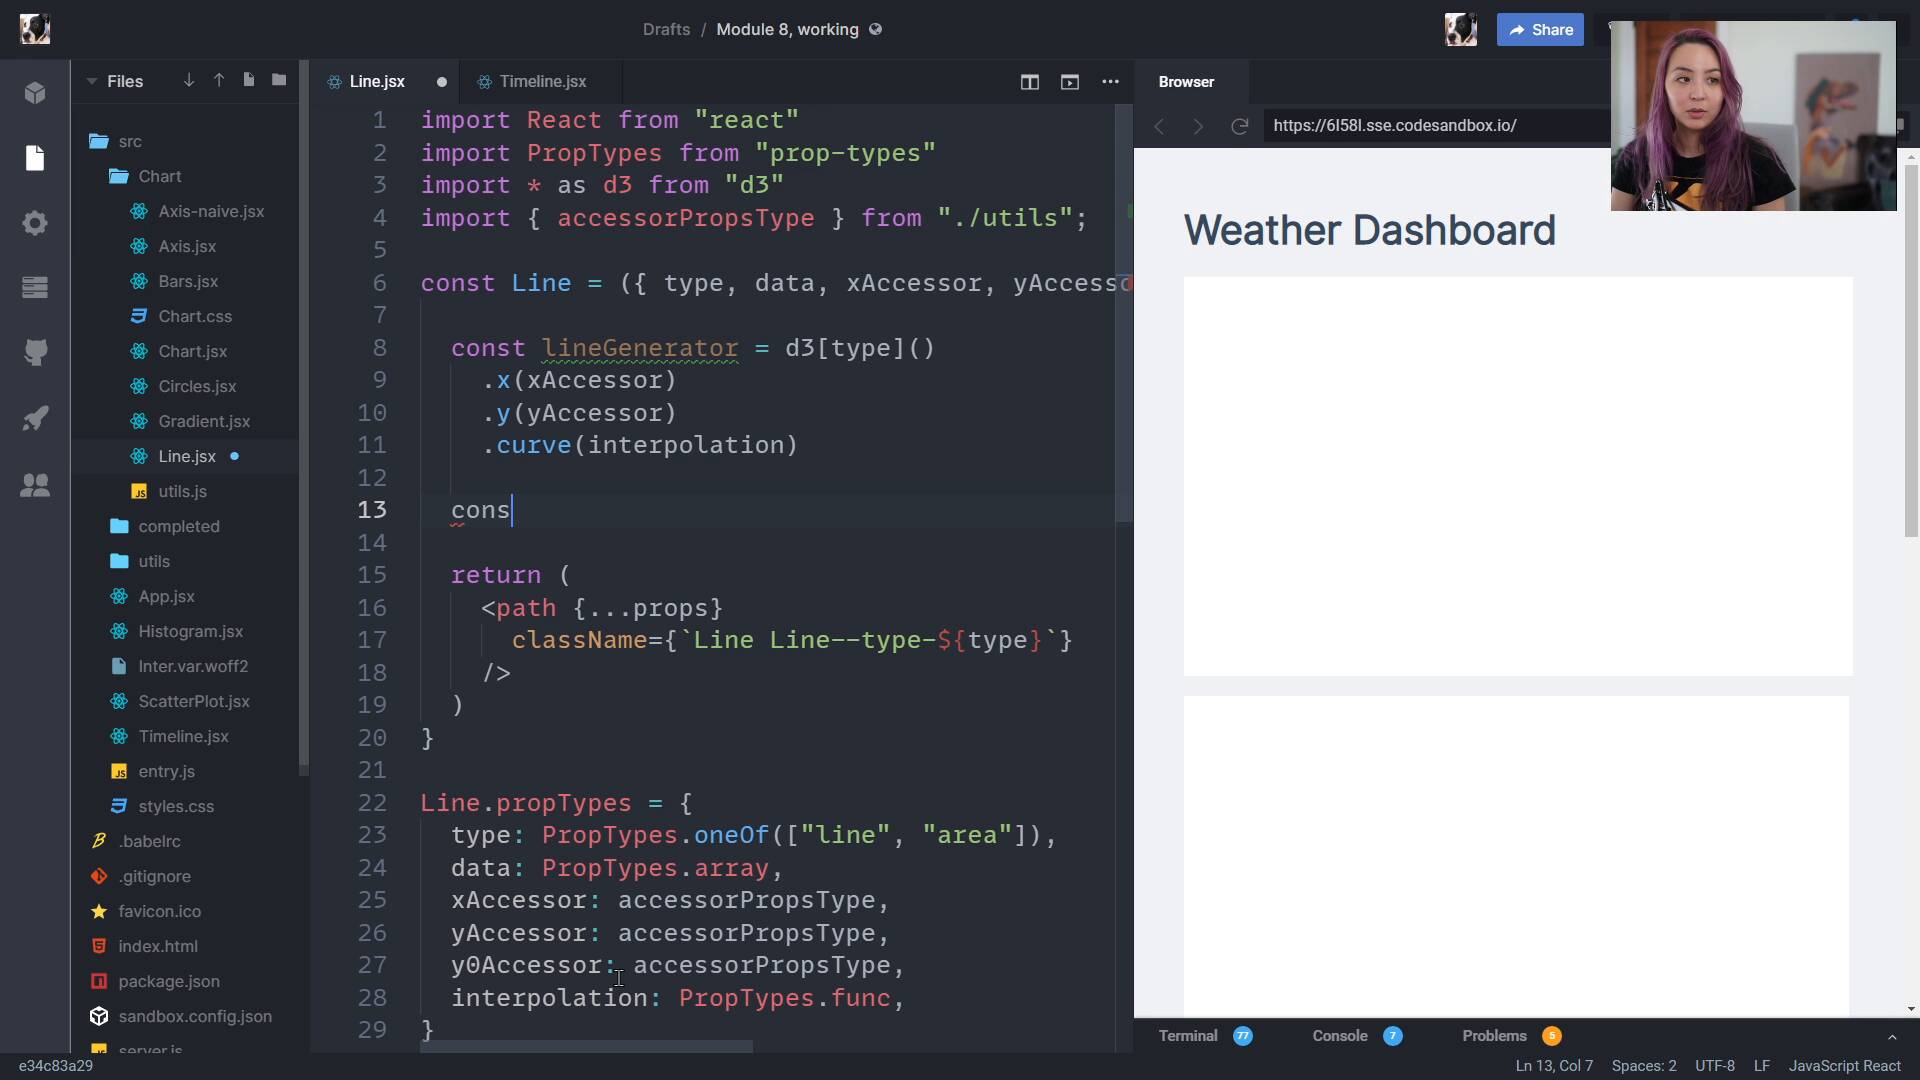
Drawing our data in ReactFullstack D3 MasterclassNext, we fill out our Line component for a flexible way to draw our data.
lesson
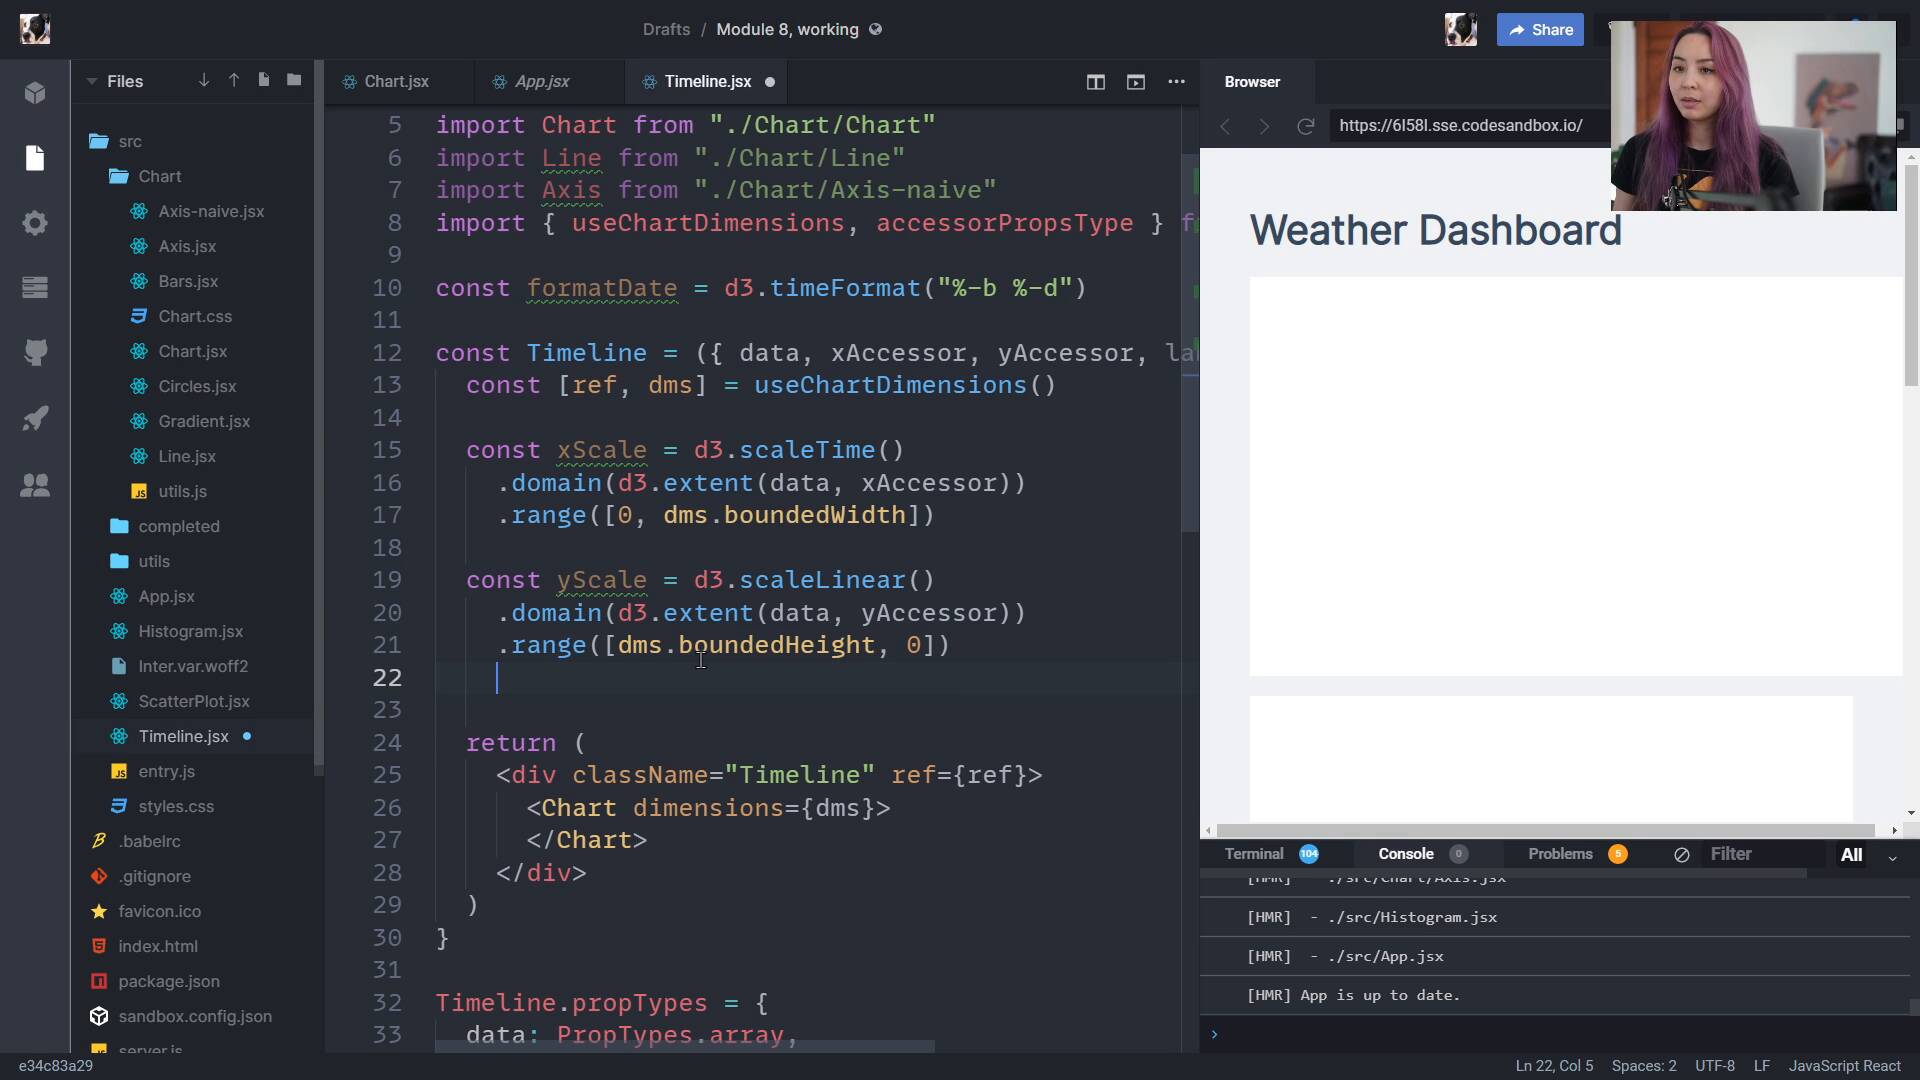
Creating our scales in ReactFullstack D3 MasterclassNext, we need to create our scales. We also create scaled accessor functions to pass to the children of our Timeline, so they don't need to know about our scales.
lesson
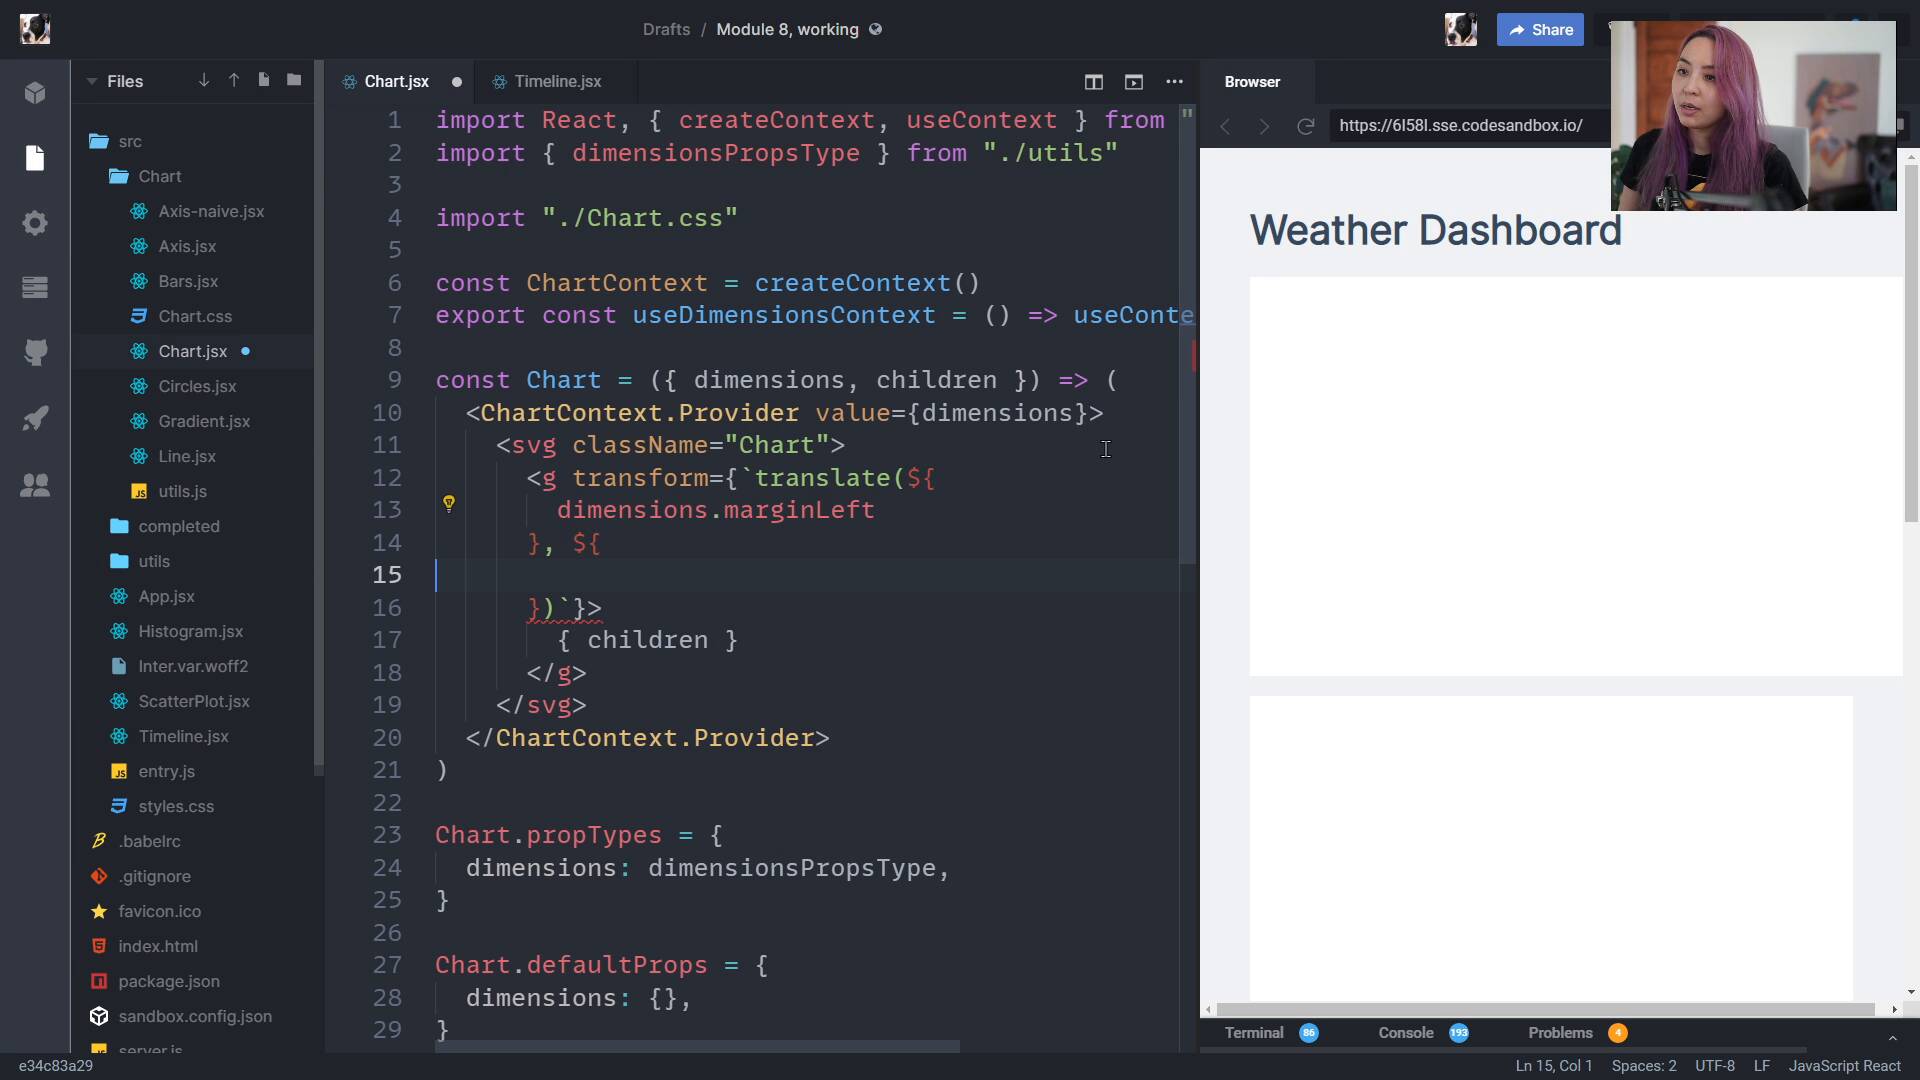
Drawing our canvas in ReactFullstack D3 MasterclassWe create our wrapper and bounds within our Chart component to prevent from having to repeat ourselves for every chart we create.
lesson
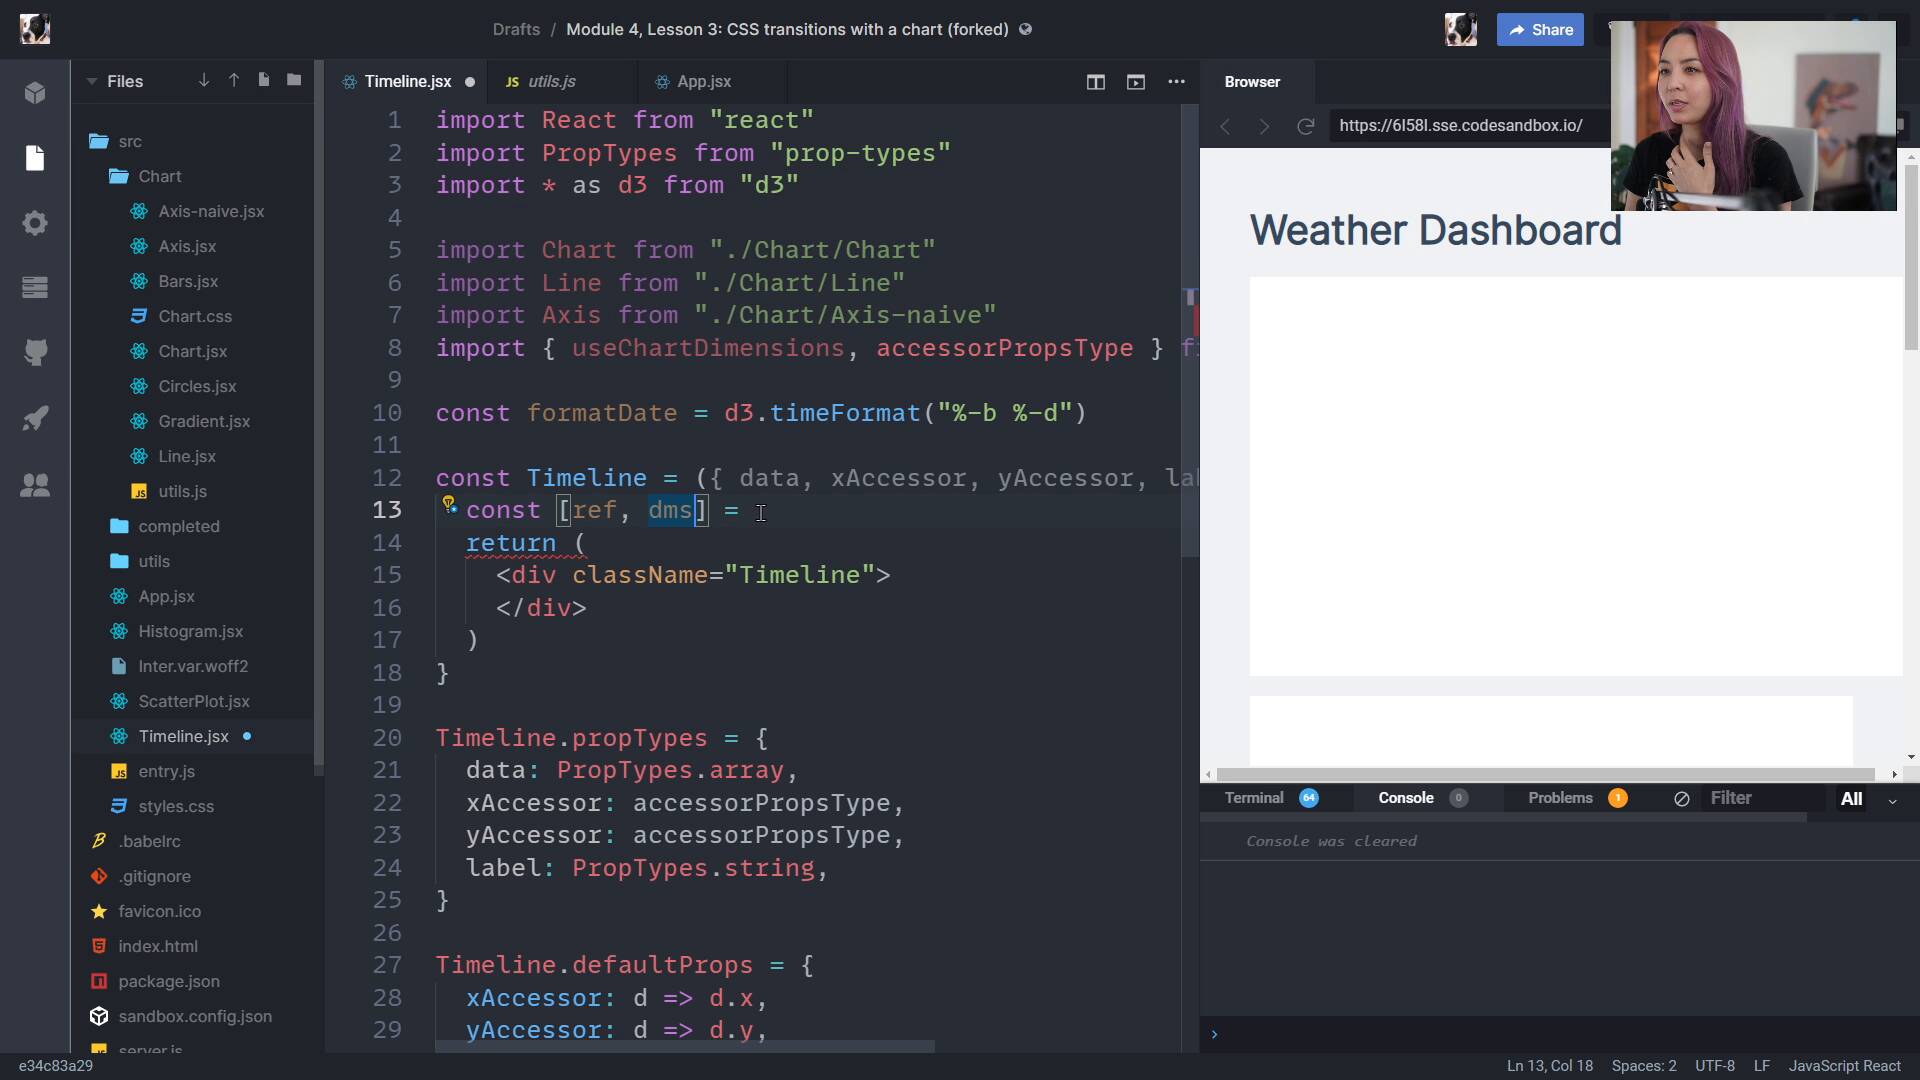
Creating dimensions in ReactFullstack D3 MasterclassCreating dimensions in React can be really easy! We use a custom hook for watching the size of our wrapper and automatically calculating the dimensions of our bounds.
lesson
Week 7: ExerciseFullstack D3 MasterclassLet's consolidate what we just learned with an exercise to play with this week.
lesson
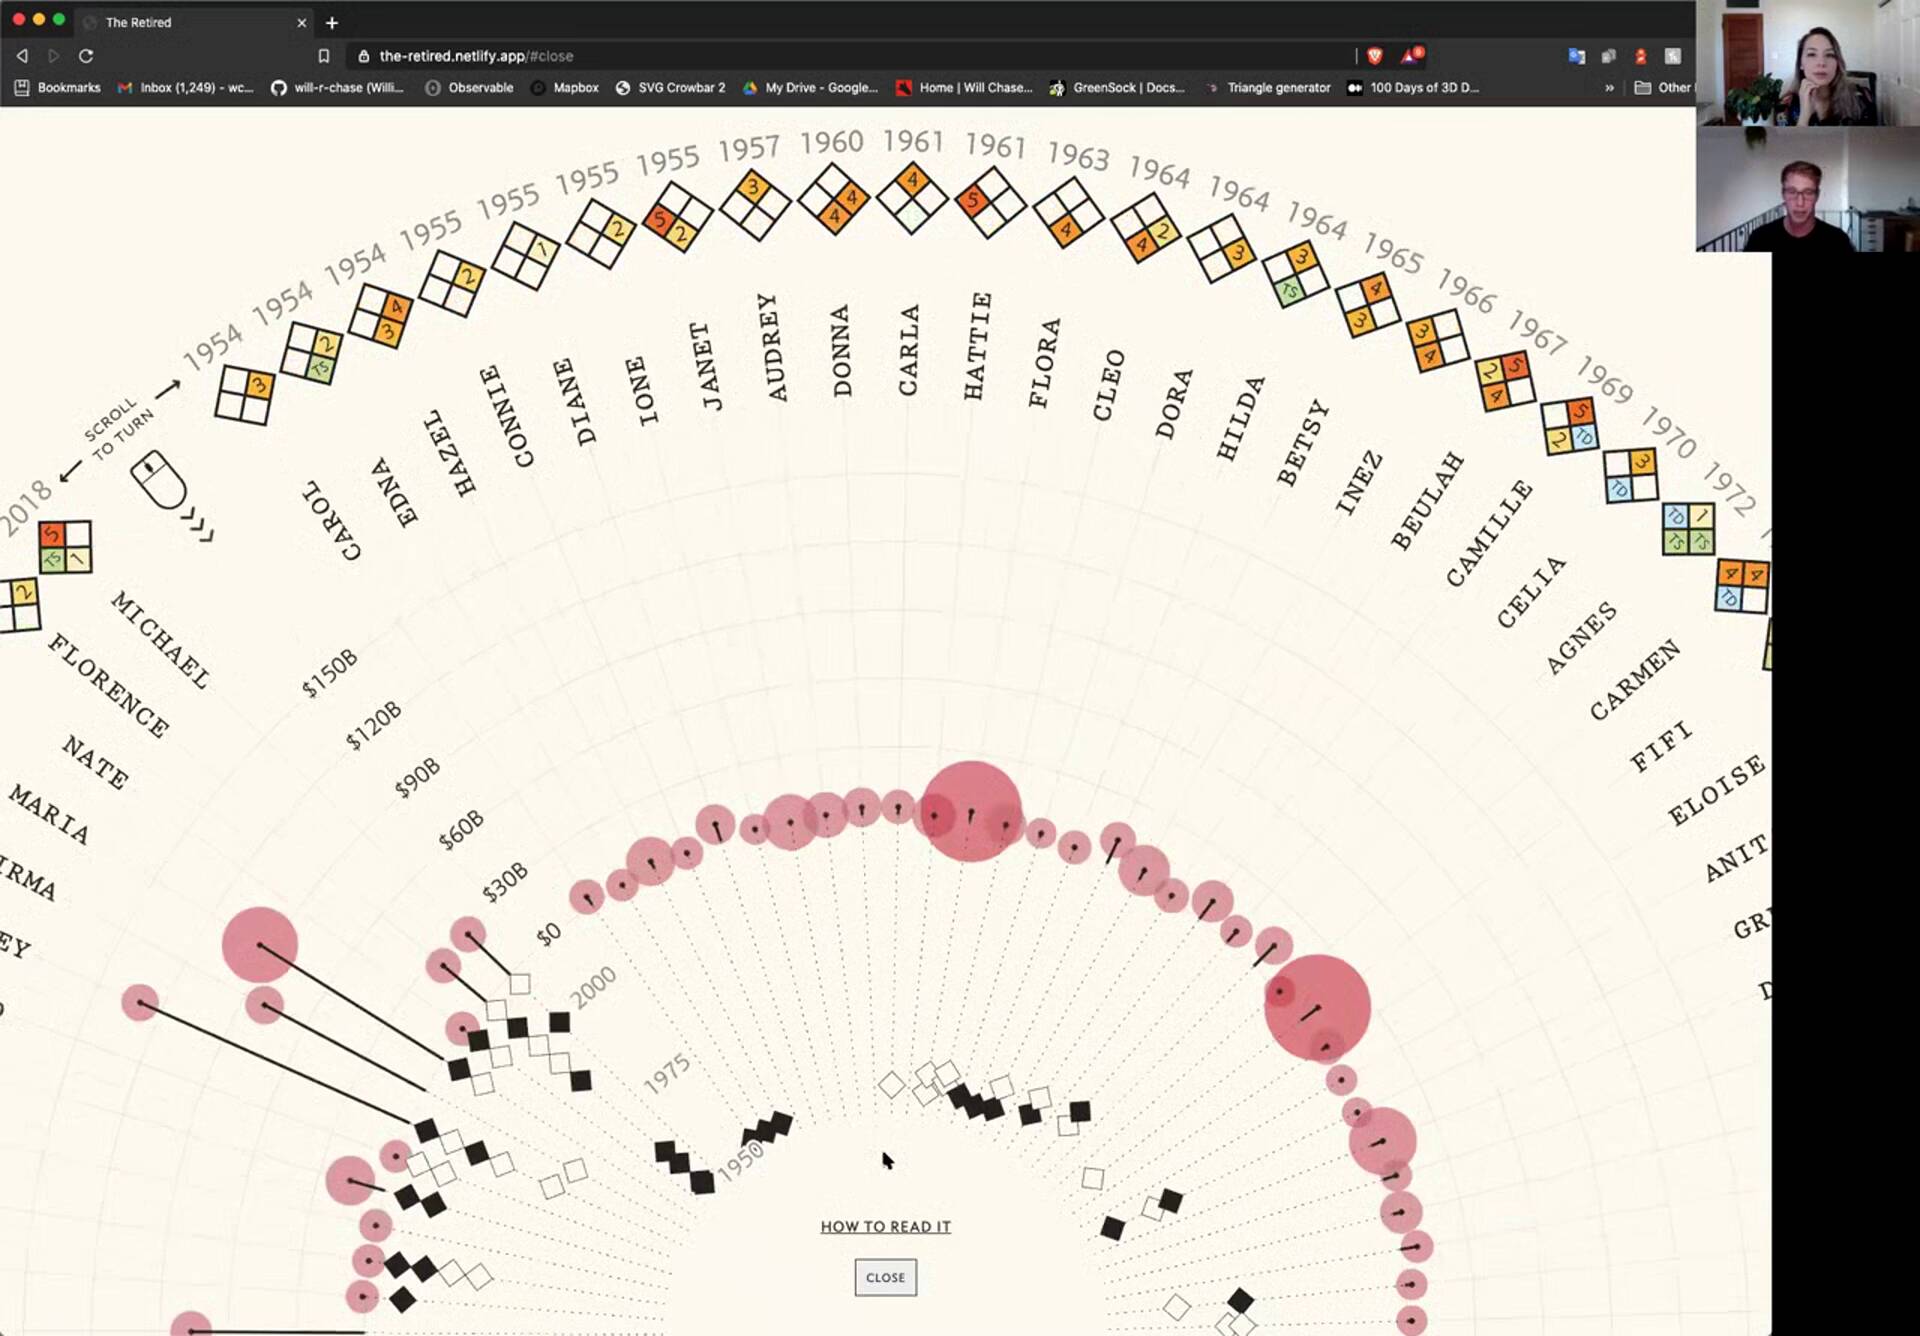
Will ChaseFullstack D3 MasterclassWill Chase talks us through how he got into data viz, the difference between work and freelance projects, and walks us through his most recent, wonderful visualization of hurricane names.
lesson
Russell GoldenbergFullstack D3 MasterclassRussell Goldenberg talks to us about what it's like working at the Pudding, his journey from Comp Sci to creative computation, and drops some great tips for working on data viz projects.


