Lessons
Explore all newline lessons

lesson
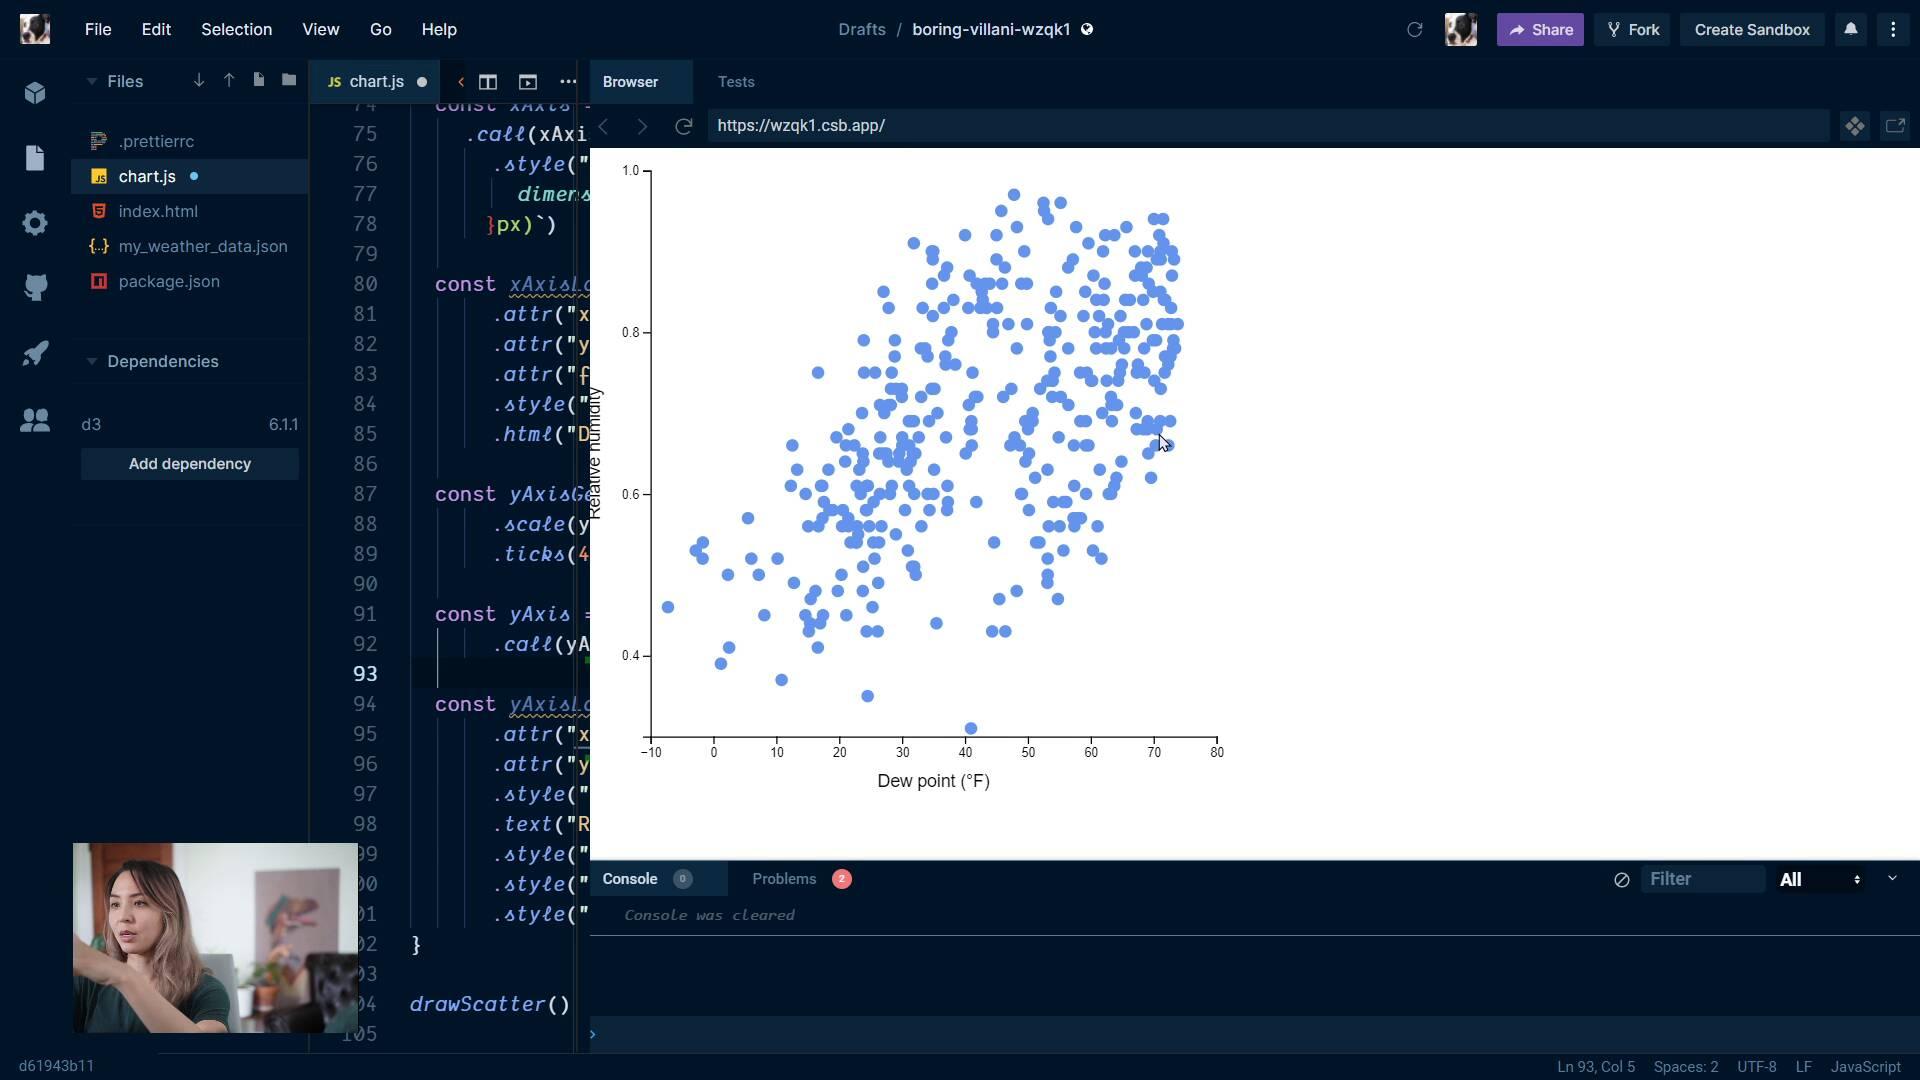
Extra credit: adding a color scaleFullstack D3 MasterclassWe learn how to create a custom color scale, then we color our circles based on another metric: cloud cover.
lesson
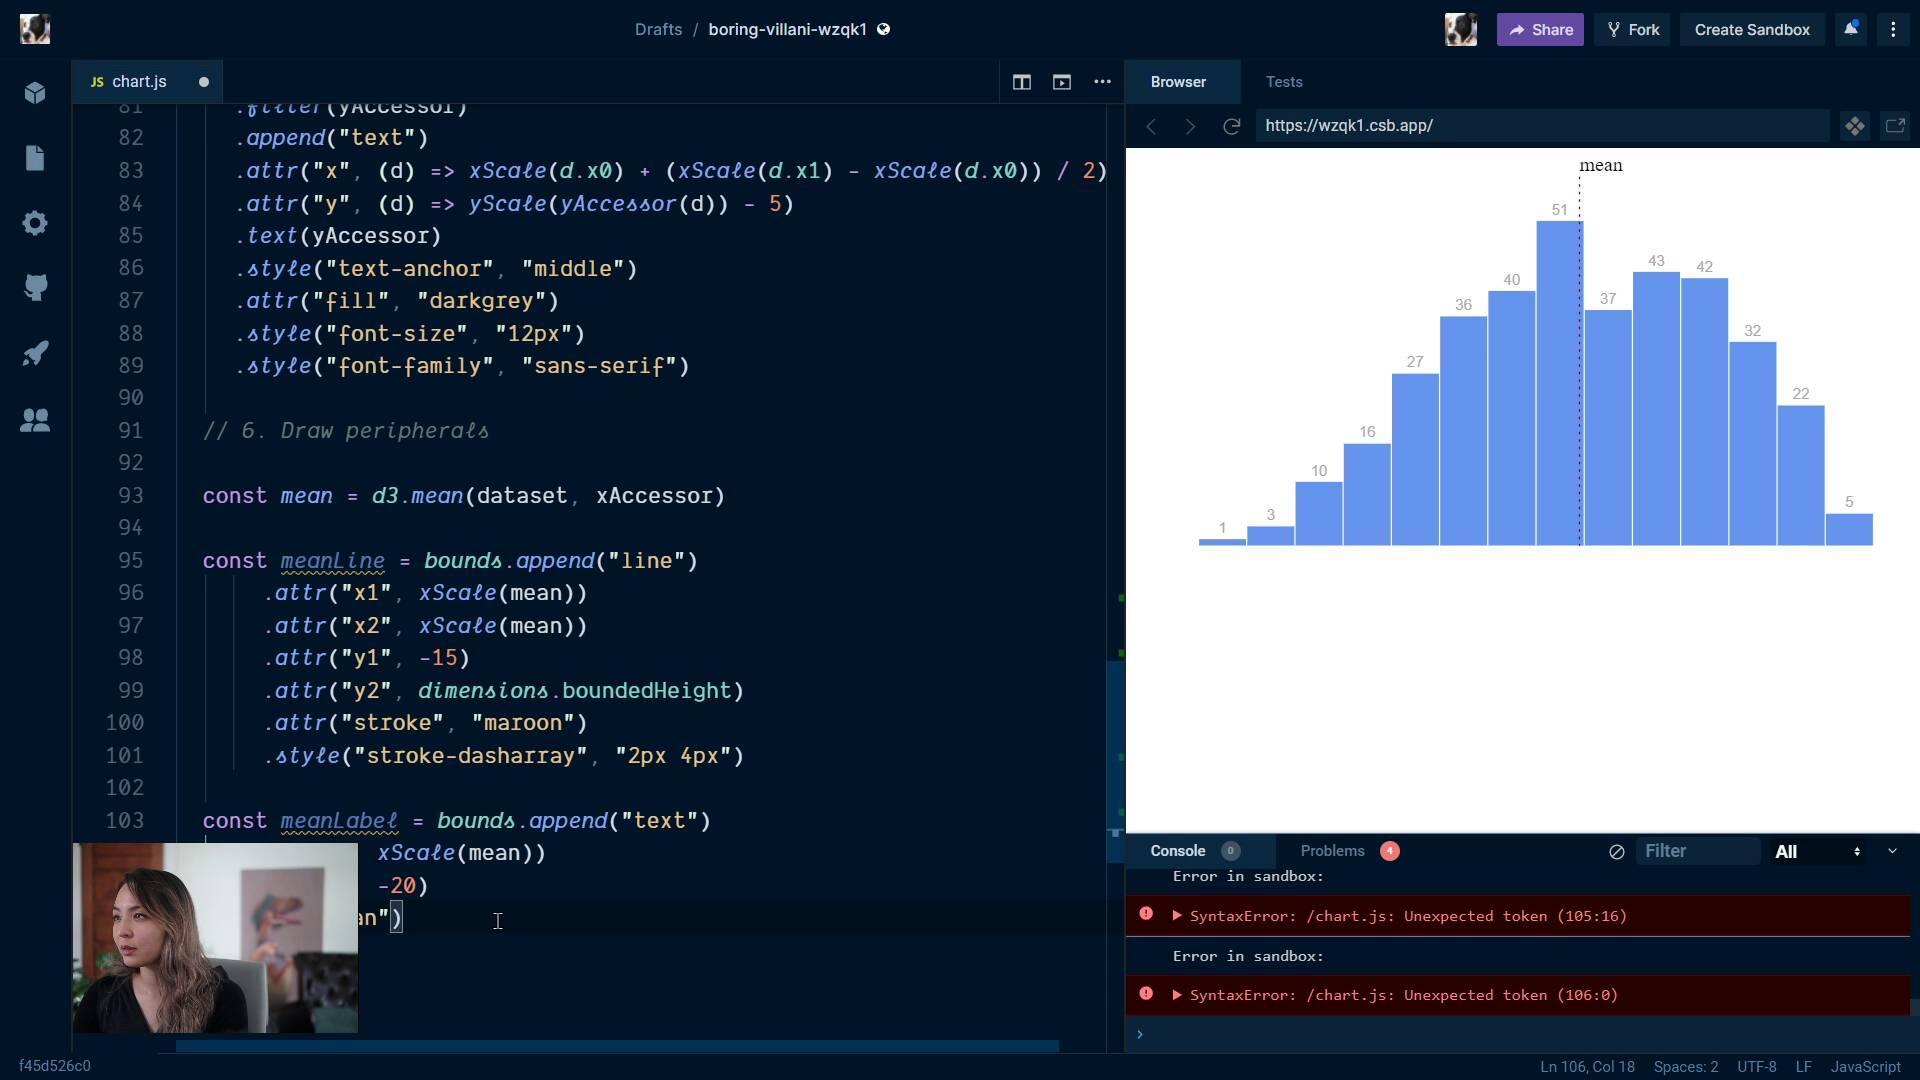
Looking at our chartFullstack D3 MasterclassOur hard work completed, we sit back and talk about what insights our chart can teach us.
lesson
Draw peripheralsFullstack D3 MasterclassWe draw a line depicting the mean of our distribution, as well as our axes.
lesson
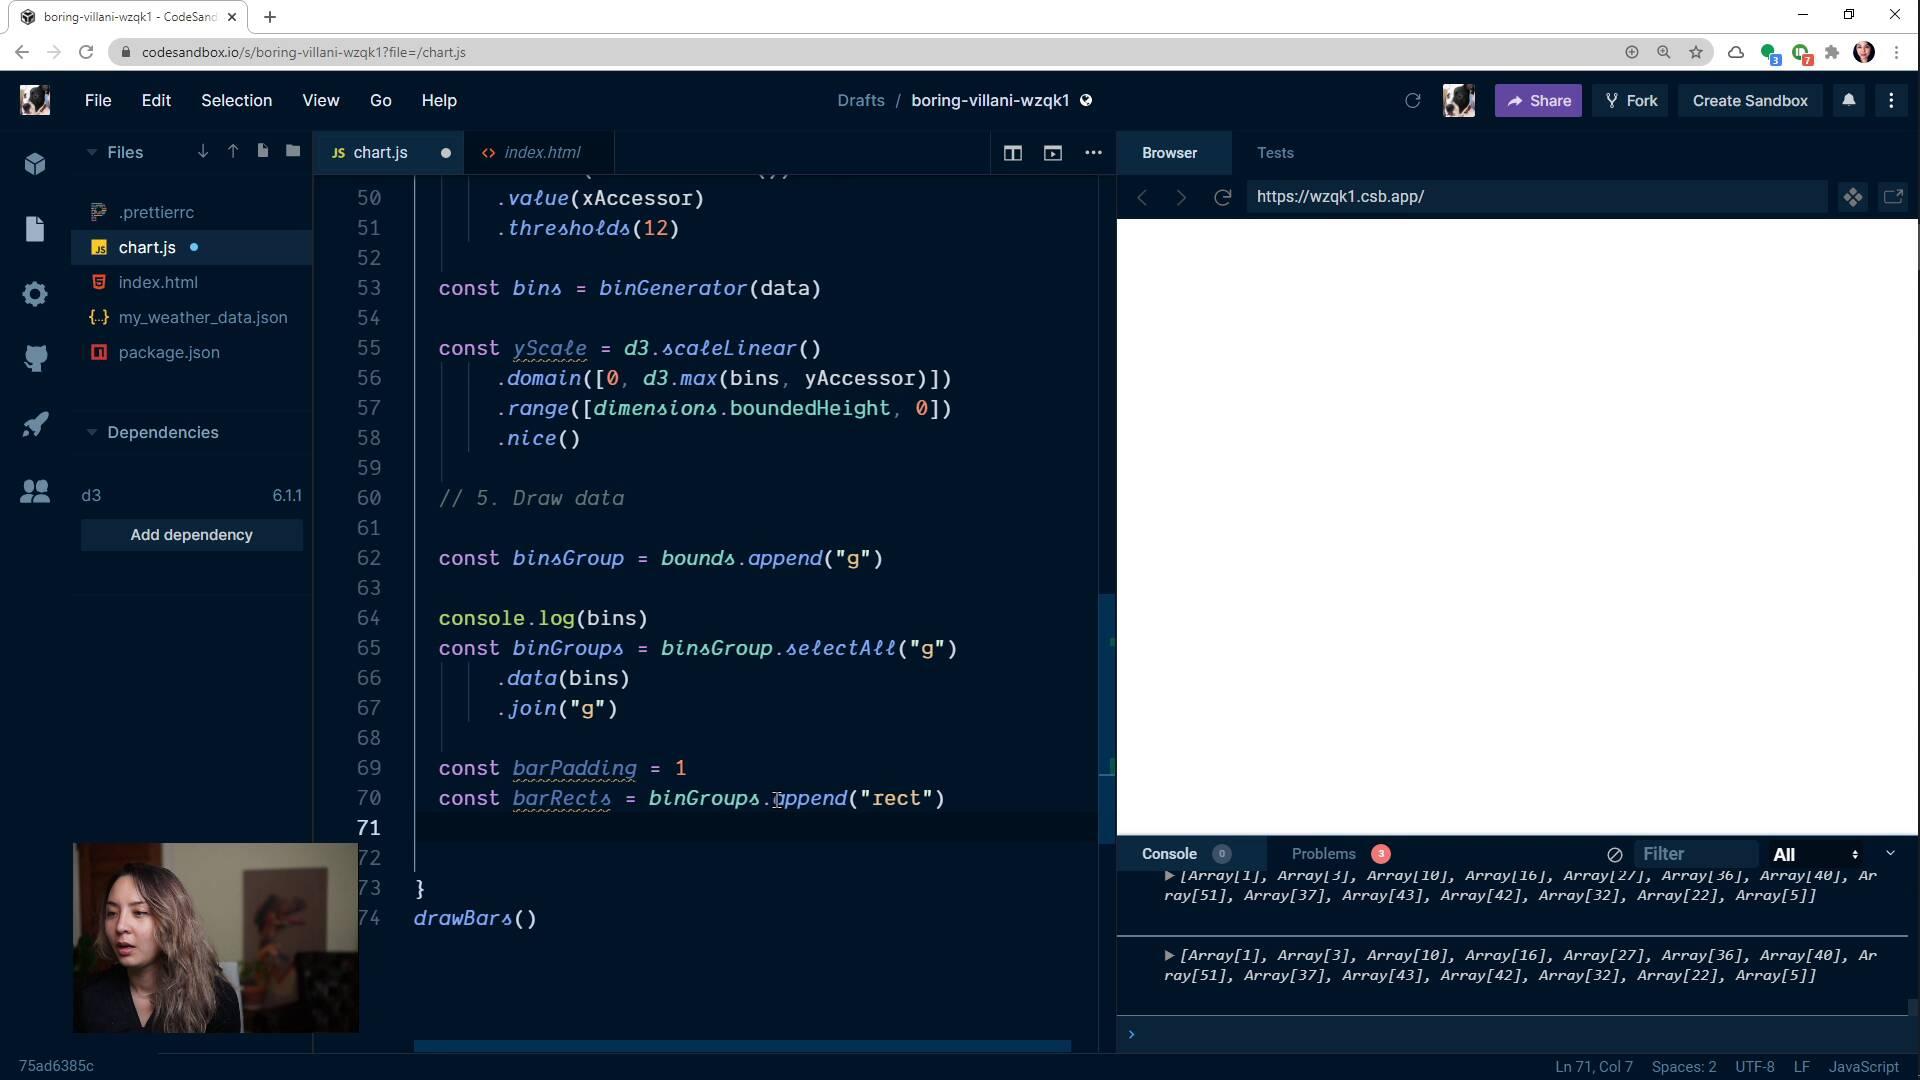
Draw dataFullstack D3 MasterclassWe finally get to draw our bars! We draw them in groups, so we can position them as well as labels.
lesson
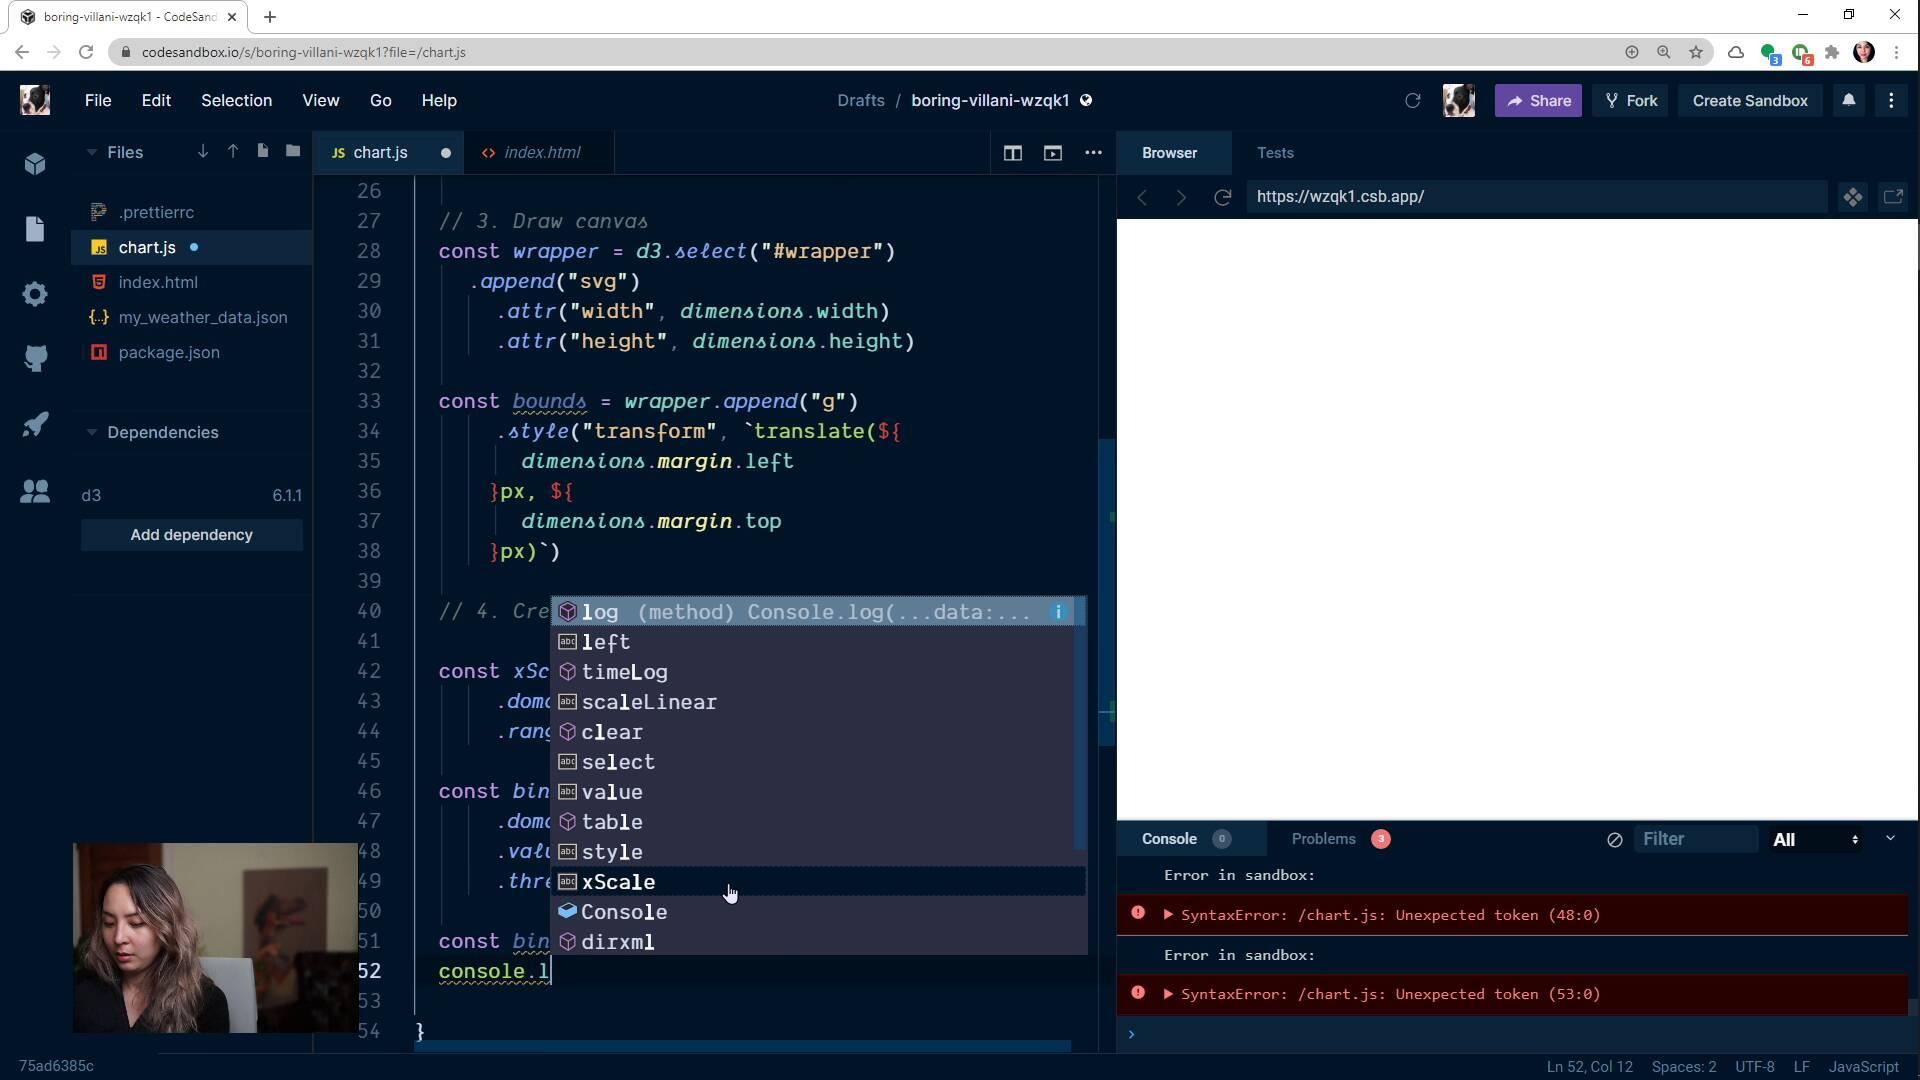
Create scalesFullstack D3 MasterclassWe create our scales, but first, we learn how to split our data into equally-sized bins.
lesson
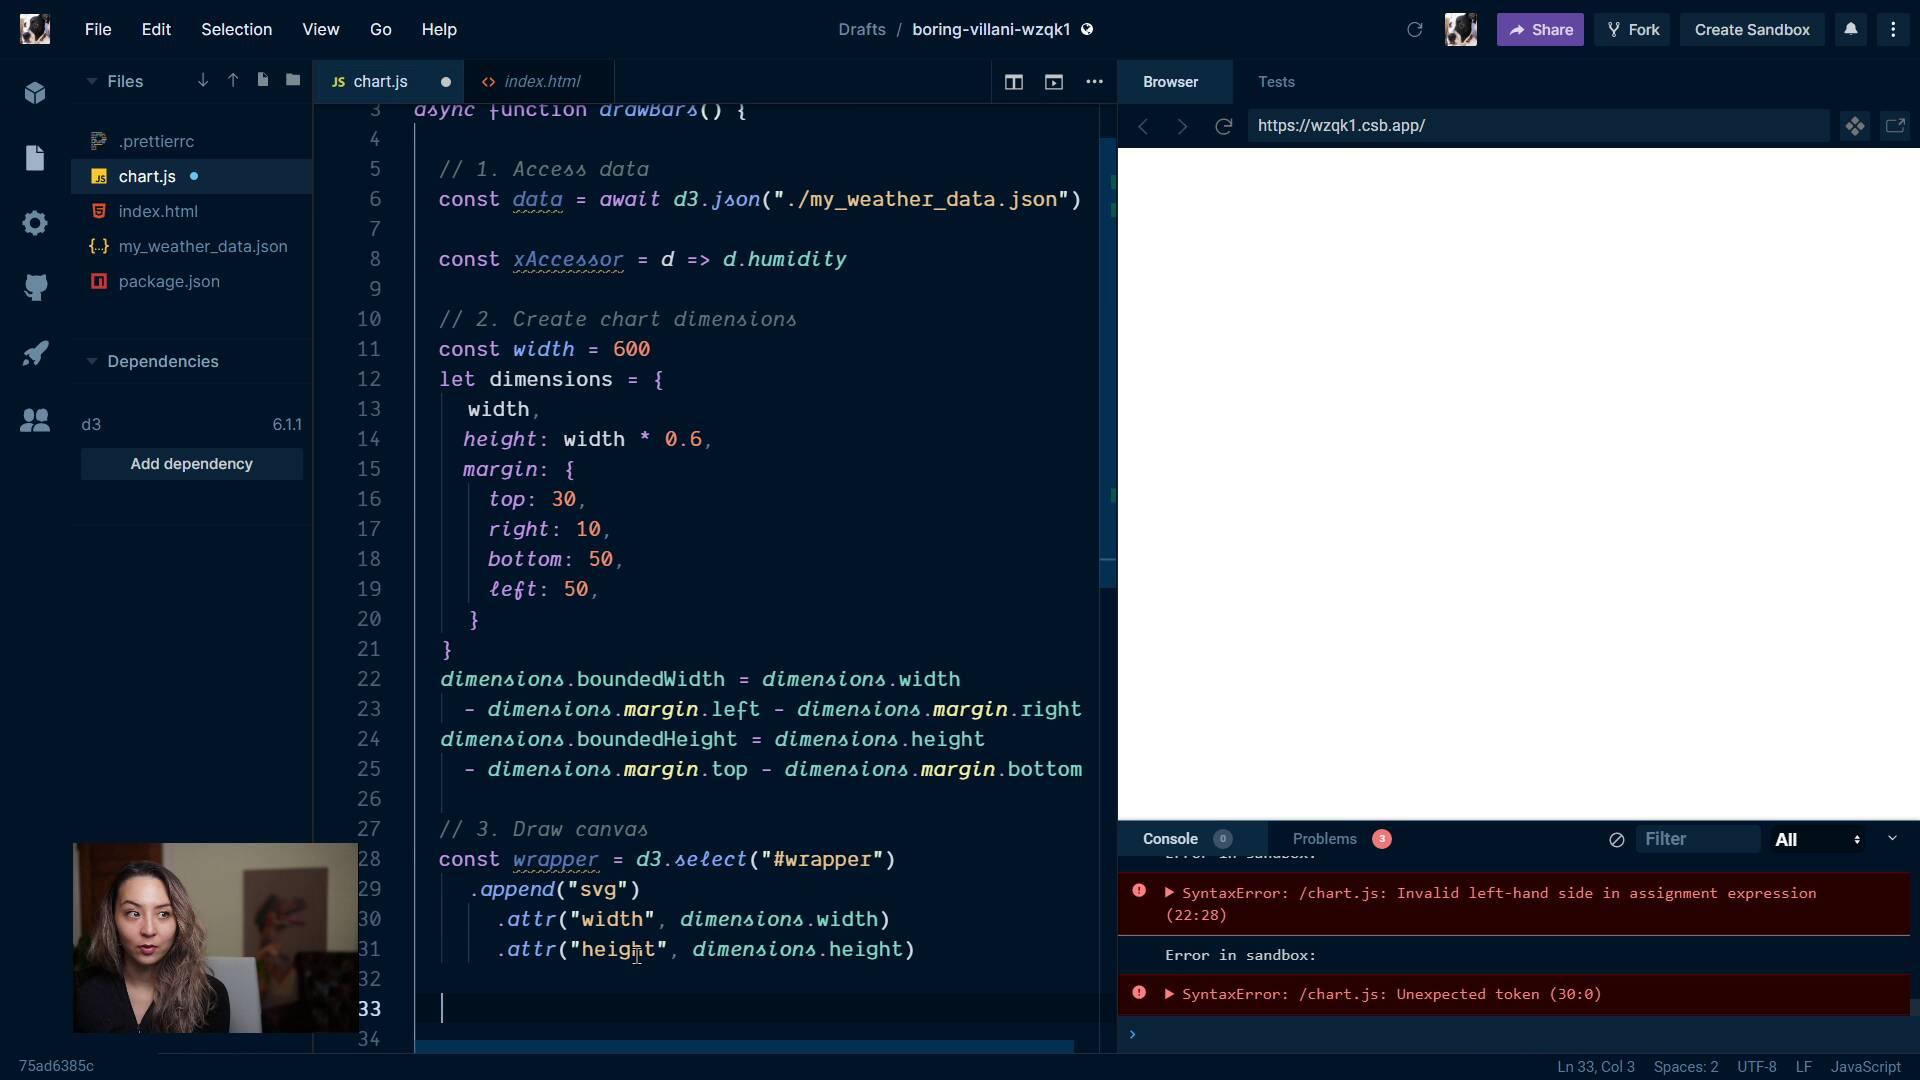
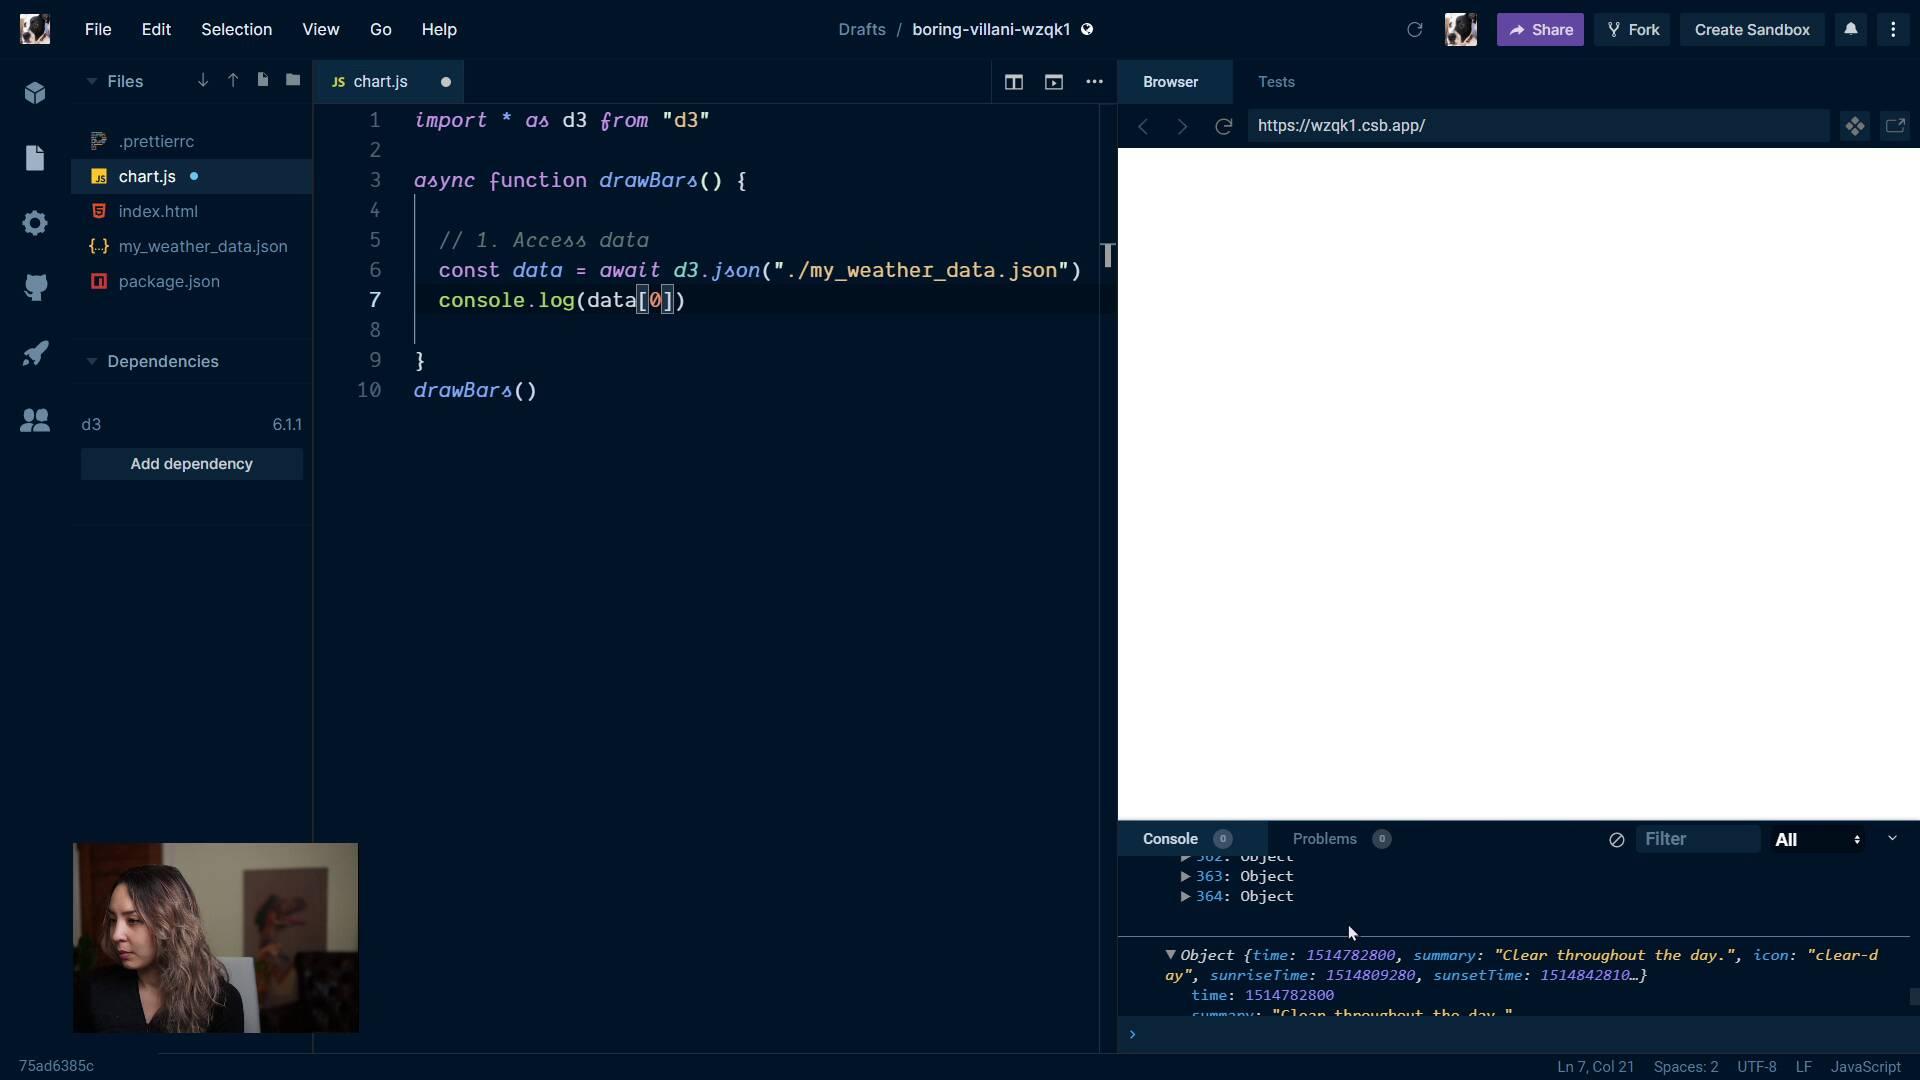
Access dataFullstack D3 MasterclassNext, we grab our data and create our accessor function (only one this time!)

lesson
Steps in drawing any chartFullstack D3 MasterclassWe solidify our foundation by splitting our chart-creating code into seven general steps.

lesson
Making a ScatterplotFullstack D3 MasterclassWe dive into making a slightly more complex chart: a scatter plot. In this lesson, we talk about why you would create a scatter plot and its basic anatomy.

lesson
Drawing the axesFullstack D3 MasterclassWe learn how to create axes and transform them into position.

lesson
Drawing the lineFullstack D3 MasterclassWe learn about path SVG elements and how to construct a string for their d attribute.

lesson
Creating our scalesFullstack D3 MasterclassWe learn about scales and create our first ones: our y and x scales.