Debugging AngularJS
When we’re building large Angular apps, it’s not uncommon to run into head-scratching issues that are seemingly difficult to uncover and resolve.
Debugging from the DOM
Although not always necessary nor a first step, we can get access to the Angular properties that are attached to any DOM element. We can use these properties to peek into how the data is flowing in our application.
We should never rely on fetching element properties from a DOM element during the lifecycle of an application. The techniques are presented as techniques for debugging purposes.
To fetch these properties from the DOM, we need to find the DOM element in which we’re interested. If we have the full jQuery library available, we can use the jQuery selector syntax: $("selector").
We don’t need to rely on jQuery, however, to target and fetch elements from the DOM. Instead, we can use the document.querySelector() method.
Note that the document.querySelector() is not available on all browsers and is generally good for non-complex element selections, whereas Sizzle (the library jQuery uses) or jQuery support more complex selections.
We can retrieve the $rootScope from the DOM by selecting the element where the ngApp directive is placed and wrapping it in an Angular element (using the angular.element() method).
With an Angular element, we can call various methods to inspect our Angular app from inside the DOM. To do so, we need to select the element from the DOM. Using only JavaScript and Angular, we can do so in this way:
var rootEle = document.querySelector("html");
var ele = angular.element(rootEle);
With this element, we can fetch various parts of our application.
scope()
We can fetch the $scope from the element (or its parent) by using the scope() method on the element:
Using the element’s scope, we can inspect any scope properties, such as custom variables that we set on the scope in our controllers. We can peek into the elements looking into its $id, its $parent object, the $watchers that are set on it and even manually walk up the scope chain.
controller()
We can fetch the current element’s controller (or its parent) by using the controller() method:
var ctrl = ele.controller();
// or
var ctrl = ele.controller('ngModel');
injector()
We can fetch the injector of the current element (or the containing element) by using the injector() method on the selected element.
var injector = ele.injector();
With this injector, we can then then instantiate any Angular object inside of our app, such as services, other controllers, or any other object.
inheritedData()
We can fetch the data associated with an element’s $scope simply by using the inheritedData() method on the element:
This inheritedData() method is how Angular finds data up the scope chain as it walks up the DOM until it’s found a particular value or until the top-most parent has been reached.
If you’re using Chrome, we can use a shortcut with the developer tools. Simply find the element you’re interested in, right click on it in the browser, and select inspect element. The element itself is stored as the $0 variable, and we can fetch the Angular-ized element by calling: angular.element($0).
Debugger
Google’s Chrome has its own debugger tool to create a breakpoint in our code. The debugger statement will cause the browser to freeze during execution, allowing us to examine the running code from inside the actual application and at the point of execution inside the browser.
To use the debugger, we can simply add it inside the context of our application code:
angular.module('myApp', [])
.factory('SessionService', function($q, $http) {
  var service = {
    user_id: null,
    getCurrentUser: function() {
      debugger; // Set the debugger inside
                // this function
      return service.user_id;
    }
  }
    return service;
});
Inside this service, we’ll call the debugger; method that effectively freezes our application.
As long as the Chrome development tools are open in our browser, we can use console.log() and other JavaScript commands at the point where this application code executes.
When we’re done debugging the application code, we need to make sure we remove this line, because it will freeze the browser, even in production.
Angular Batarang
Angular Batarang is a Chrome extension developed by the Angular team at Google that integrates very nicely as a debugging tool for Angular apps.
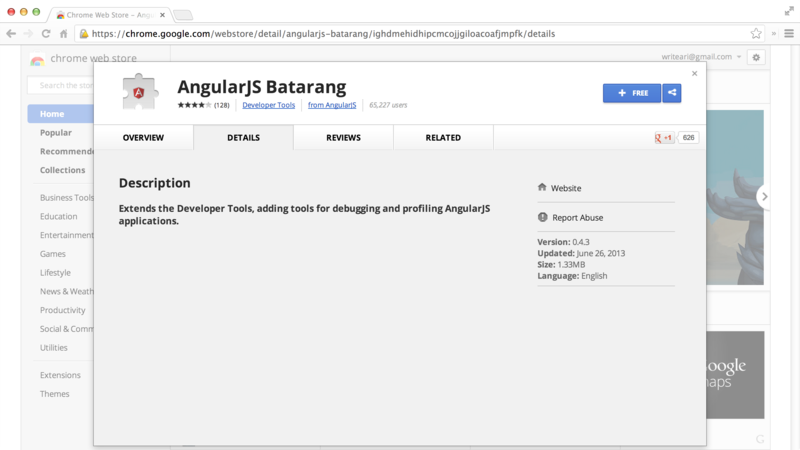
Installing Batarang
To install Batarang, we simply need to download the application from the web store or from the GitHub repo: https://github.com/angular/angularjs-batarang.
Once our installation is set, we can start up the extension by navigating to our developer tools and clicking enable to enable Batarang to start collecting debugging information about our page.
Batarang allows us to look at scopes, performance, dependencies, and other key metrics in Angular apps.
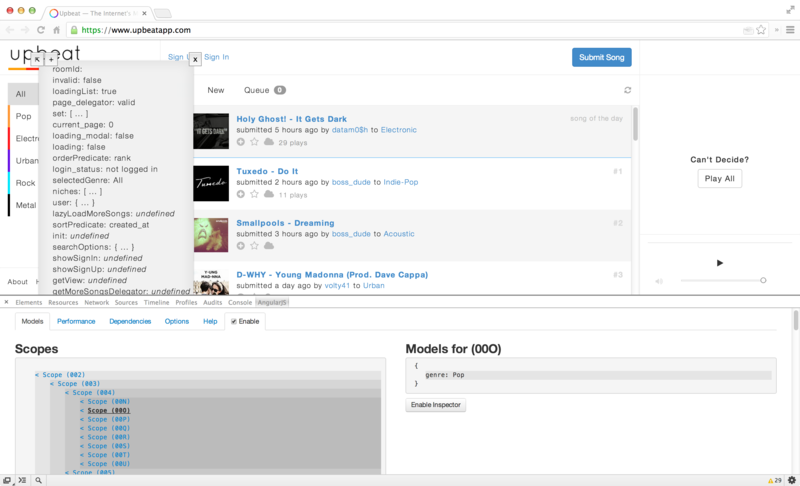
Inspecting the Models
After we’ve started up Batarang, the page will reload, and we’ll notice that we have a panel that enables us to select different scopes in our page.
We can select a scope by clicking on the + button, finding the element we’re interested in and clicking on it.
Once we select a scope using the inspector, we can look at all the different properties on our scope element and their current values.
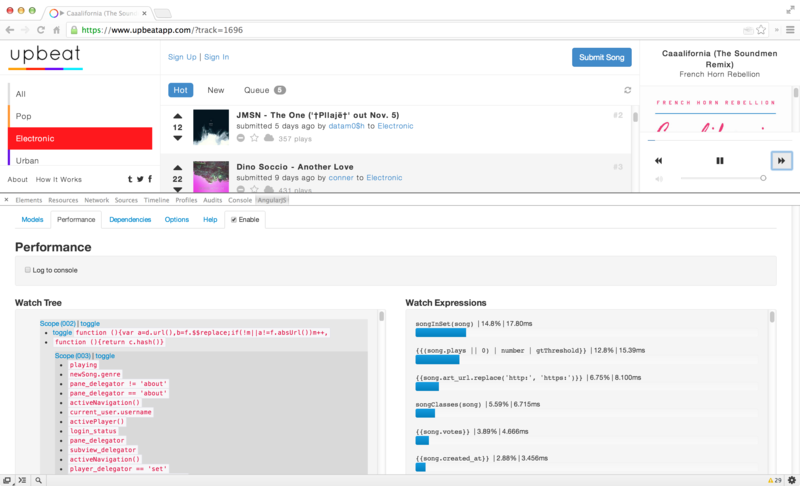
We can also peek into the performance of our application by using the performance section of Batarang.
In this panel, we get a peek into the watch list of the application at the different scopes as well as the amount of time that each expression takes, both in absolute time and percentage of the overall application time.
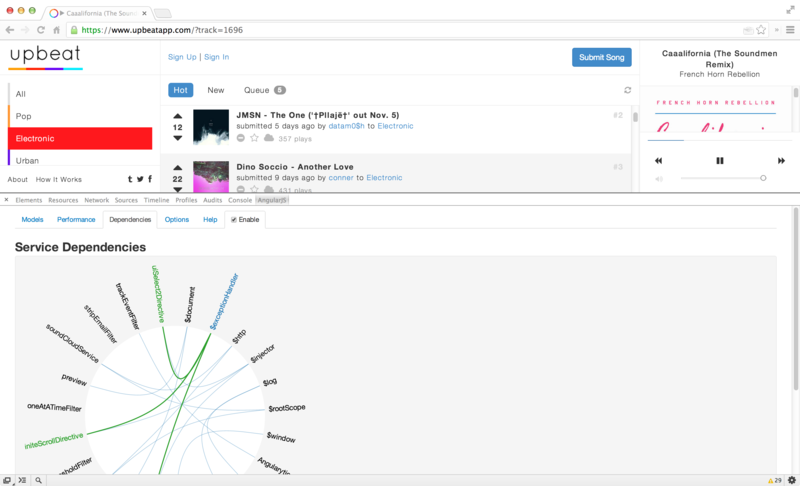
Inspecting the Dependency Graph
One very nice feature of the Batarang tool is its ability to visualize the dependency graph inline. We can look at the dependencies of our application and view the different libraries of our application to see what they depend upon and track libraries that aren’t dependencies of the application at all.
Visualizing the App
Batarang allows us to look deep into the application on the page itself. Using the Options panel, we can look at:
Applications
The different applications that are on a single page (the ngApp directive uses).
Bindings
The bindings that are set in the view, where we use either ng-bind or elements that are surrounded in the template tags {{ }}.
Scopes
The scopes in the view that we can target and inspect more deeply
The options panel also allows us view the Angular version of the app and what we’re using or not using from a CDN.
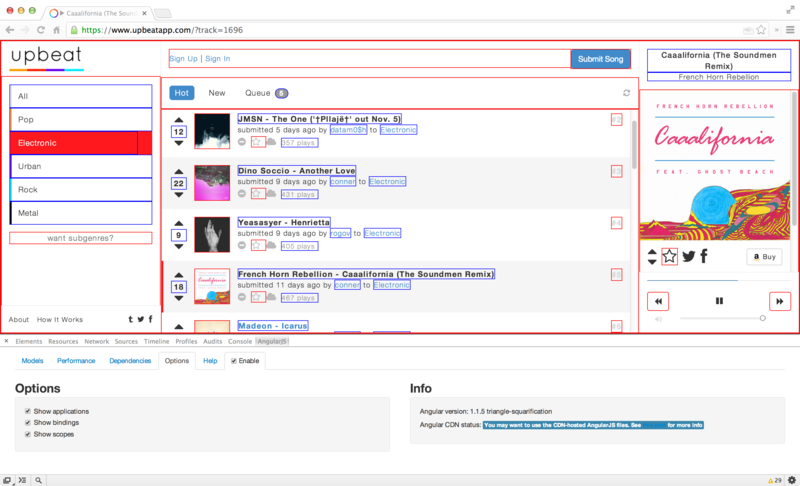
All in all, the Batarang tools gives us a lot of power when diving into how our Angular apps work in real time.
Ready to master AngularJS?
- What if you could master the entire framework – with solid foundations – in less time without beating your head against a wall? Imagine how quickly you could work if you knew the best practices and the best tools?
- Stop wasting your time searching and have everything you need to be productive in one, well-organized place, with complete examples to get your project up without needing to resort to endless hours of research.
- You will learn what you need to know to work professionally with ng-book: The Complete Book on AngularJS or get your money back.
Get it now